
ZeroPlot
Plot anything with zero effort.
Turn intent, data, or references into editable visual artifacts.



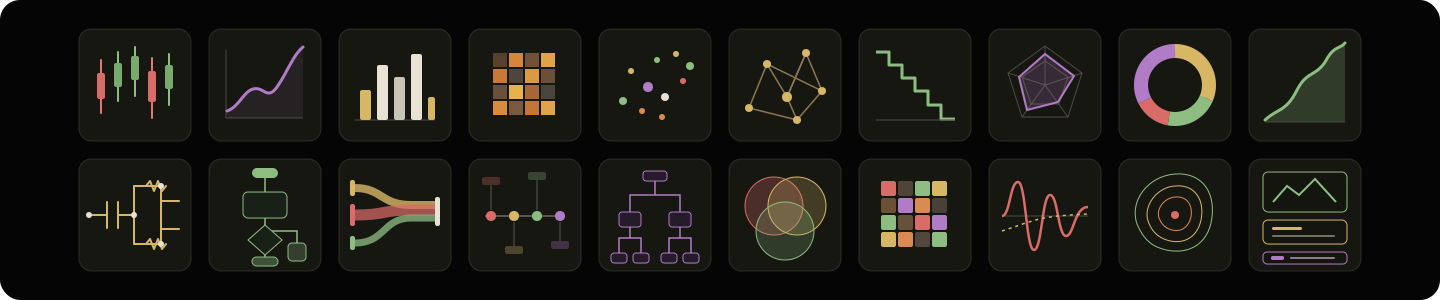
One visual system. Every format.
ZeroPlot is an Agent Skill for creating and redesigning structured visuals. It starts from what you mean—not which drawing tool you know.
Intent / Data / Reference
            ↓
        Visual Spec
            ↓
Chart · Diagram · Figure · Poster · Slide
            ↓
     Editable Source + Export
plot means composing visual elements, not only statistical plotting.
What it creates
| Artifact | Typical inputs | Preferred outputs |
|---|---|---|
| Charts | datasets, metrics, tables | matplotlib, SVG, PDF, PNG |
| Diagrams | system descriptions, code, rough sketches | draw.io, SVG, Mermaid |
| Technical figures | papers, netlists, screenshots, domain specs | TikZ, SVG, draw.io |
| Posters | narrative, figures, brand constraints | PPTX, SVG, PDF |
| Slides | outline, evidence, existing deck | PPTX, structured slide source |
Scientific figures are the first proving ground—not the product boundary.
Core contract
ZeroPlot optimizes for four things:
- Intent first — start from meaning and constraints.
- Structure preserved — keep entities, relationships, and data auditable.
- Editable by default — prefer source formats over flattened pixels.
- Domain aware — visual grammar changes across fields and audiences.
Install
Codex
npx skills add blackblue-labs/zeroplot -g -a codex -y
Manual
Copy skills/zeroplot into your agent's skill directory.
Try it
Use ZeroPlot to turn this CSV into a publication-ready editable chart.

Reconstruct this screenshot as an editable draw.io system diagram.

Turn this technical report into a five-slide visual narrative.
Initial domain packs
| Domain | Coverage | Status |
|---|---|---|
| Integrated circuits | schematics, switched-capacitor diagrams, architecture blocks | seed |
| Computer science | systems, models, pipelines, evaluation setups | seed |
Research
One research outcome behind ZeroPlot:
Demonstrating chart-plot: Closing the Last Mile of Academic Chart Generation
Accepted at ADS 2026: The Joint Workshop on Agentic Data Systems and Data-Centric AI (The 1st ADS & 3rd DATAI), co-located with VLDB 2026.
If ZeroPlot helps your work, please cite:
@misc{tang2026chartplot,
  title         = {Demonstrating chart-plot: Closing the Last Mile of Academic Chart Generation},
  author        = {Tang, Yinghao and Xie, Yupeng and Feng, Yingchaojie and Lao, Jiale and Lan, Tingfeng and Chen, Wei},
  year          = {2026},
  eprint        = {2606.09174},
  archivePrefix = {arXiv},
  url           = {https://arxiv.org/abs/2606.09174}
}
Roadmap
- Chart, diagram, and schematic generation
- Reference-image reconstruction into editable structure
- Poster and slide workflows
- Domain rubrics and held-out visual benchmarks
- Generation → editing → export loop
Contributors
ZeroPlot credits contributors by fields and work—not only commit count.
| Contributor | Background | Fields | Contributions |
|---|---|---|---|
| MisterBrookT | CS PhD @ ZJU | Computer science, scientific visualization, AI agents | Creator, product direction, initial visual domains |
Contributing a domain pack, benchmark, visual rubric, workflow, or integration? Add your background, fields, and contribution in the same pull request.
License
MIT. Built by Black Blue Labs.
No comments yet
Be the first to share your take.