
Kairos - Uptime Monitor




Kairos is a self-hosted uptime and availability monitoring application built with Spring Boot. It periodically checks whether your HTTP services, Docker images, and TCP endpoints are reachable, can discover Docker images from repository prefixes, stores a full check history, and presents the results on a clean status dashboard - with Prometheus metrics included.
Screenshots
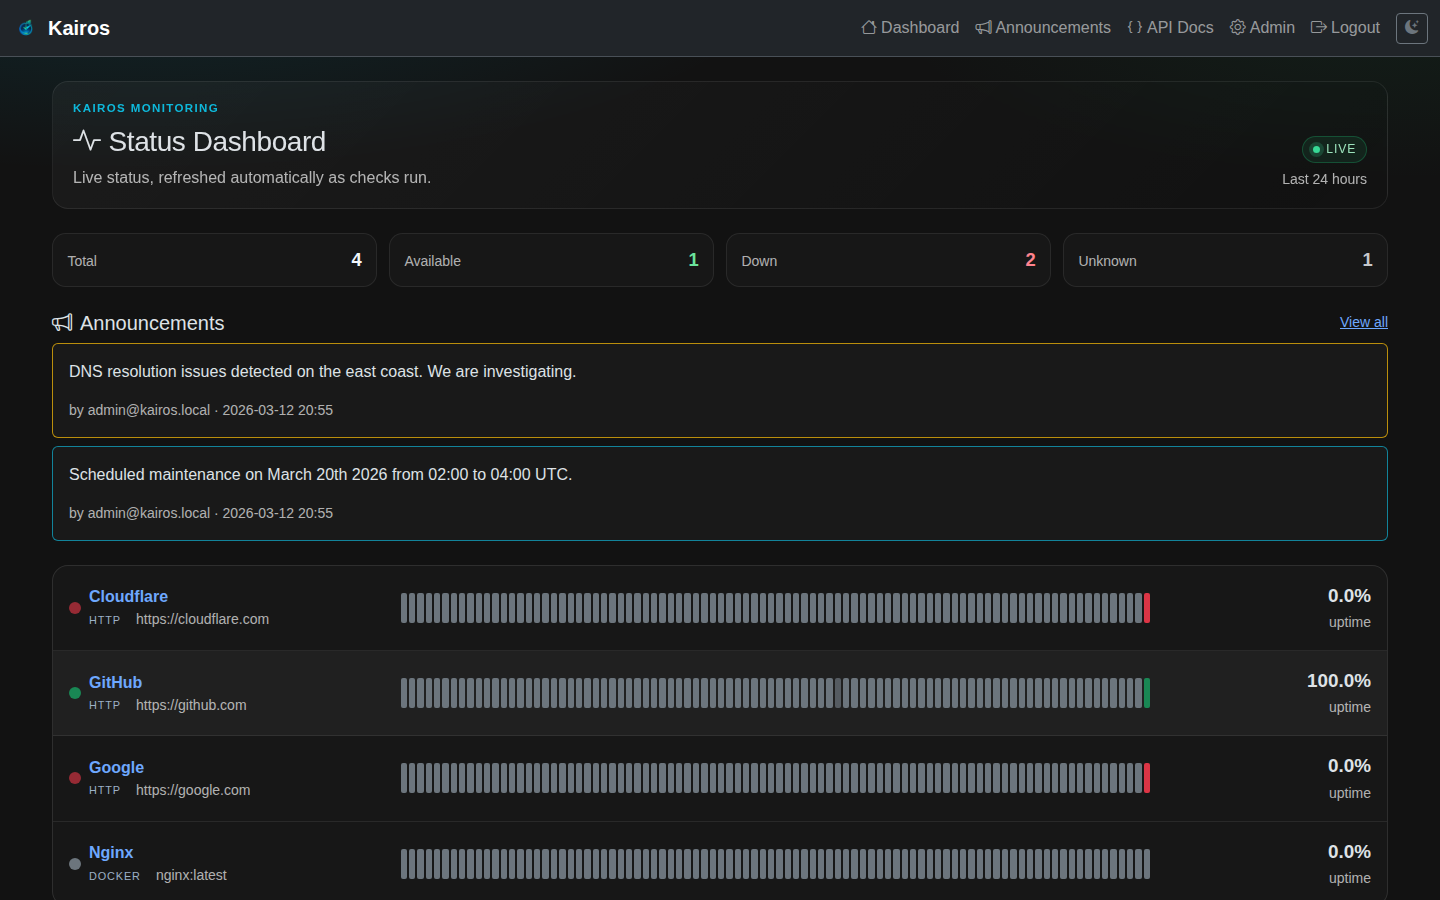
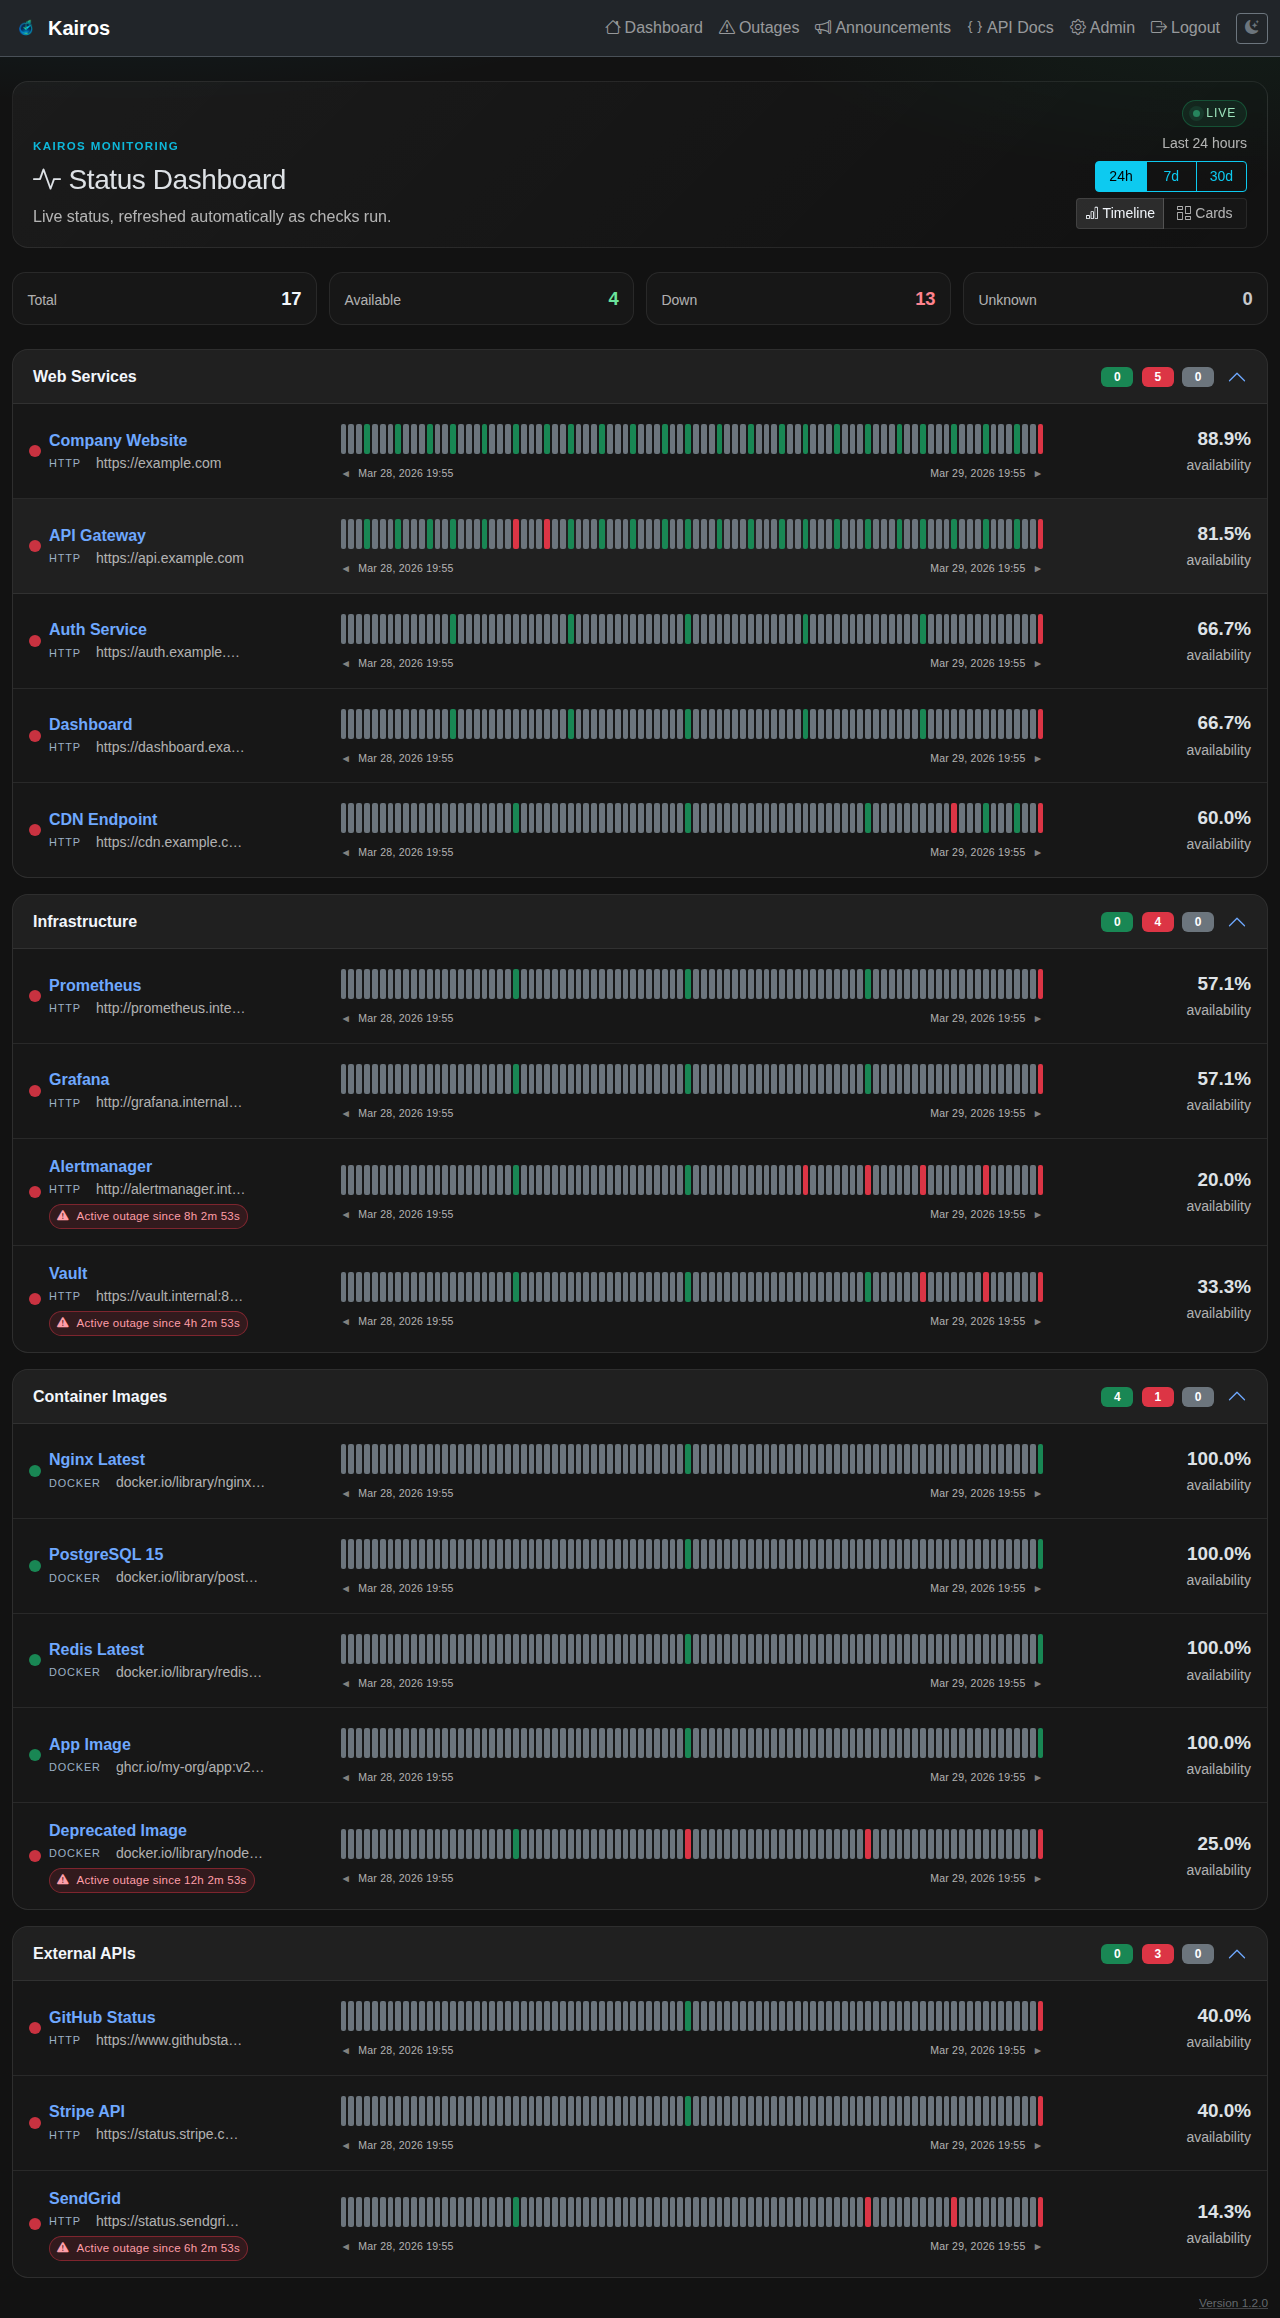 Status Dashboard (Timeline) Status Dashboard (Timeline) |
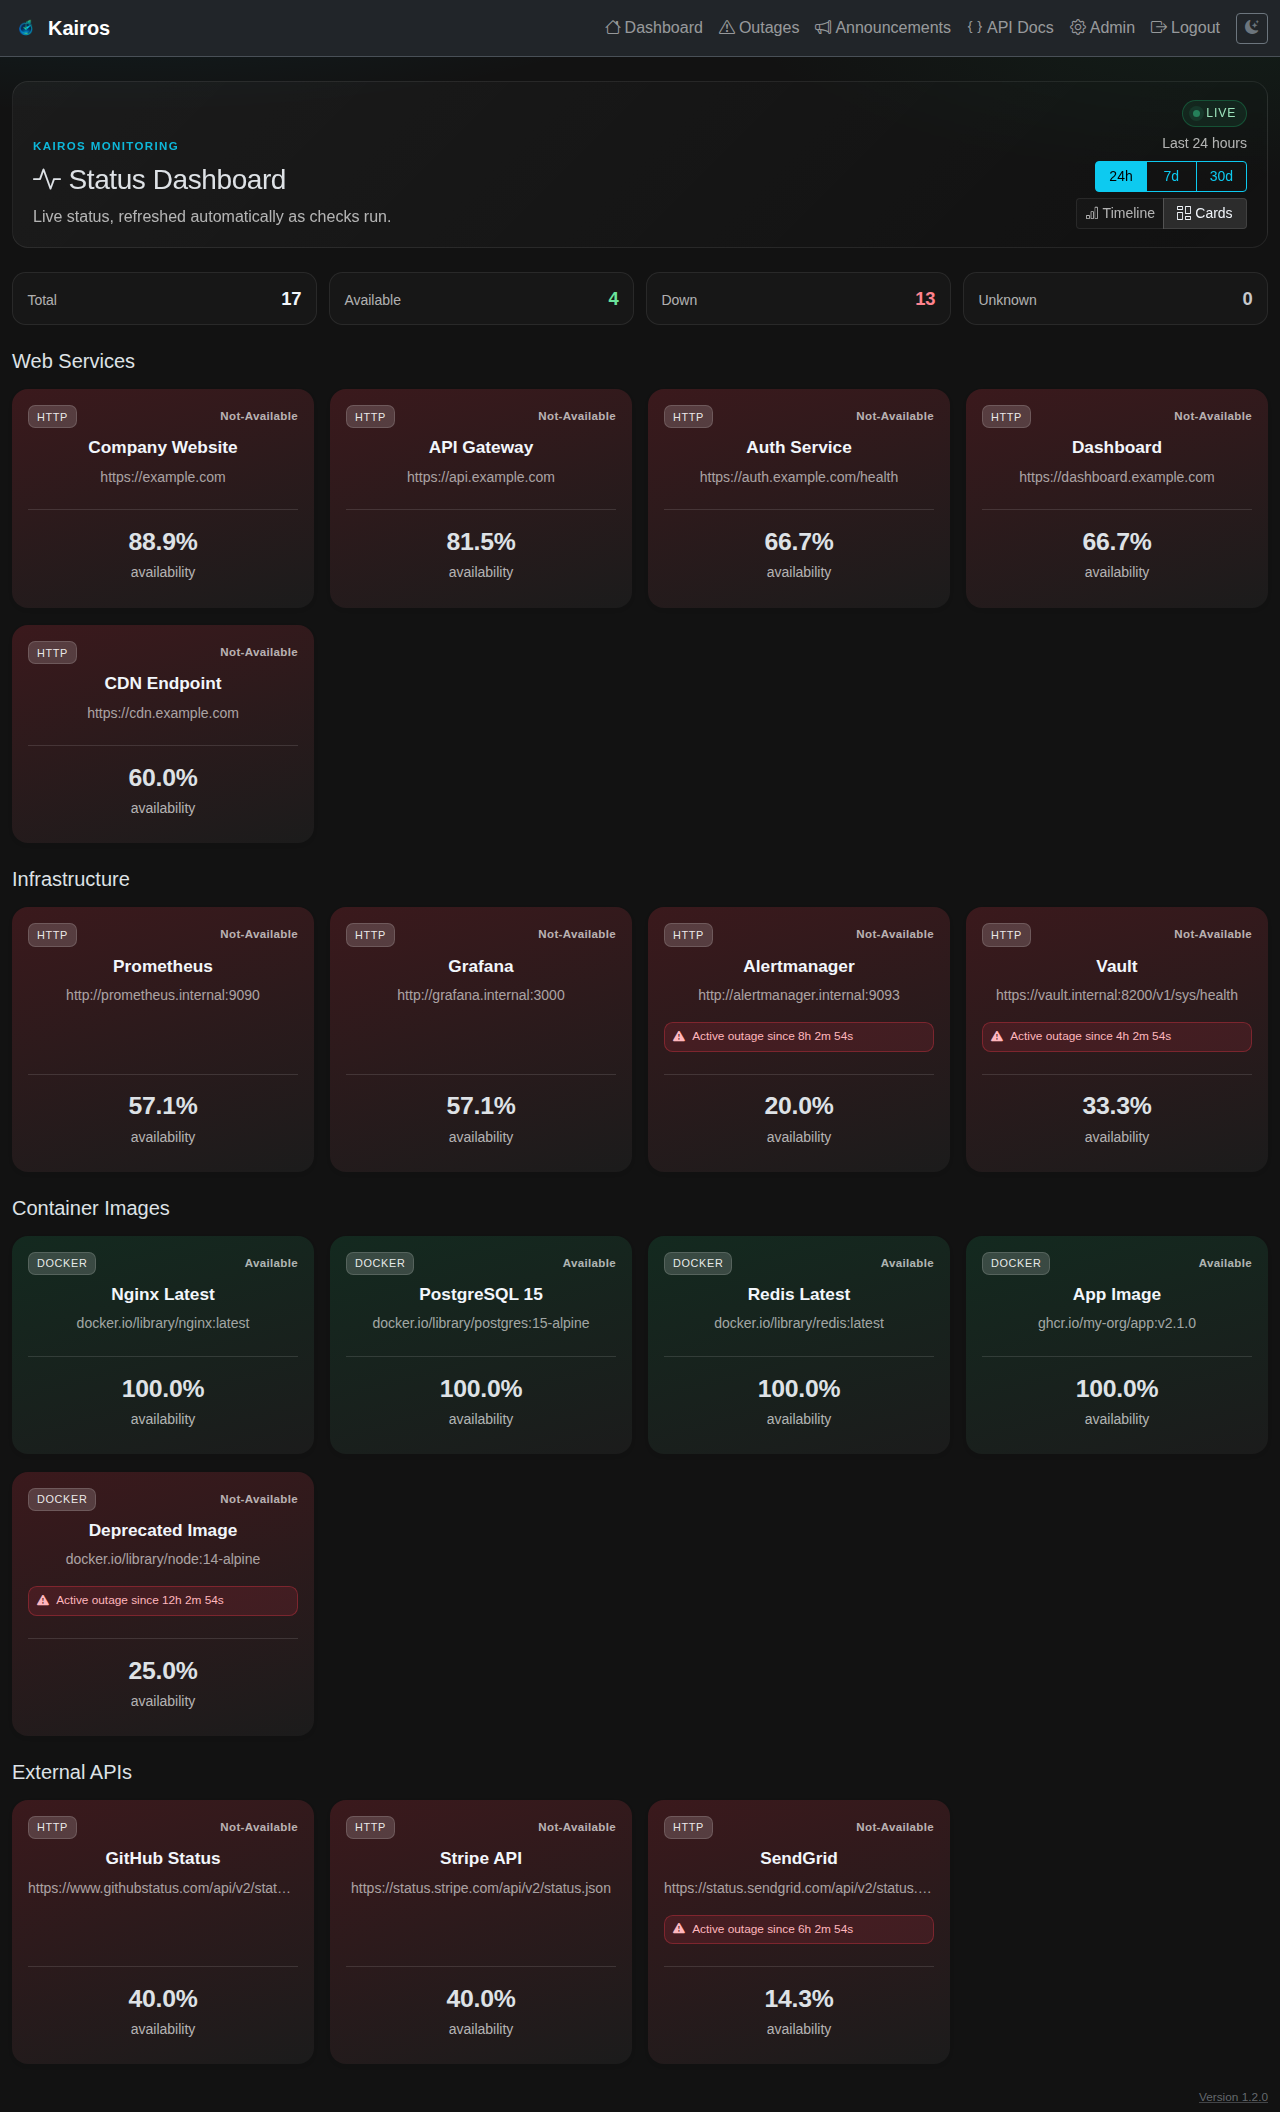 Status Dashboard (Card view) Status Dashboard (Card view) |
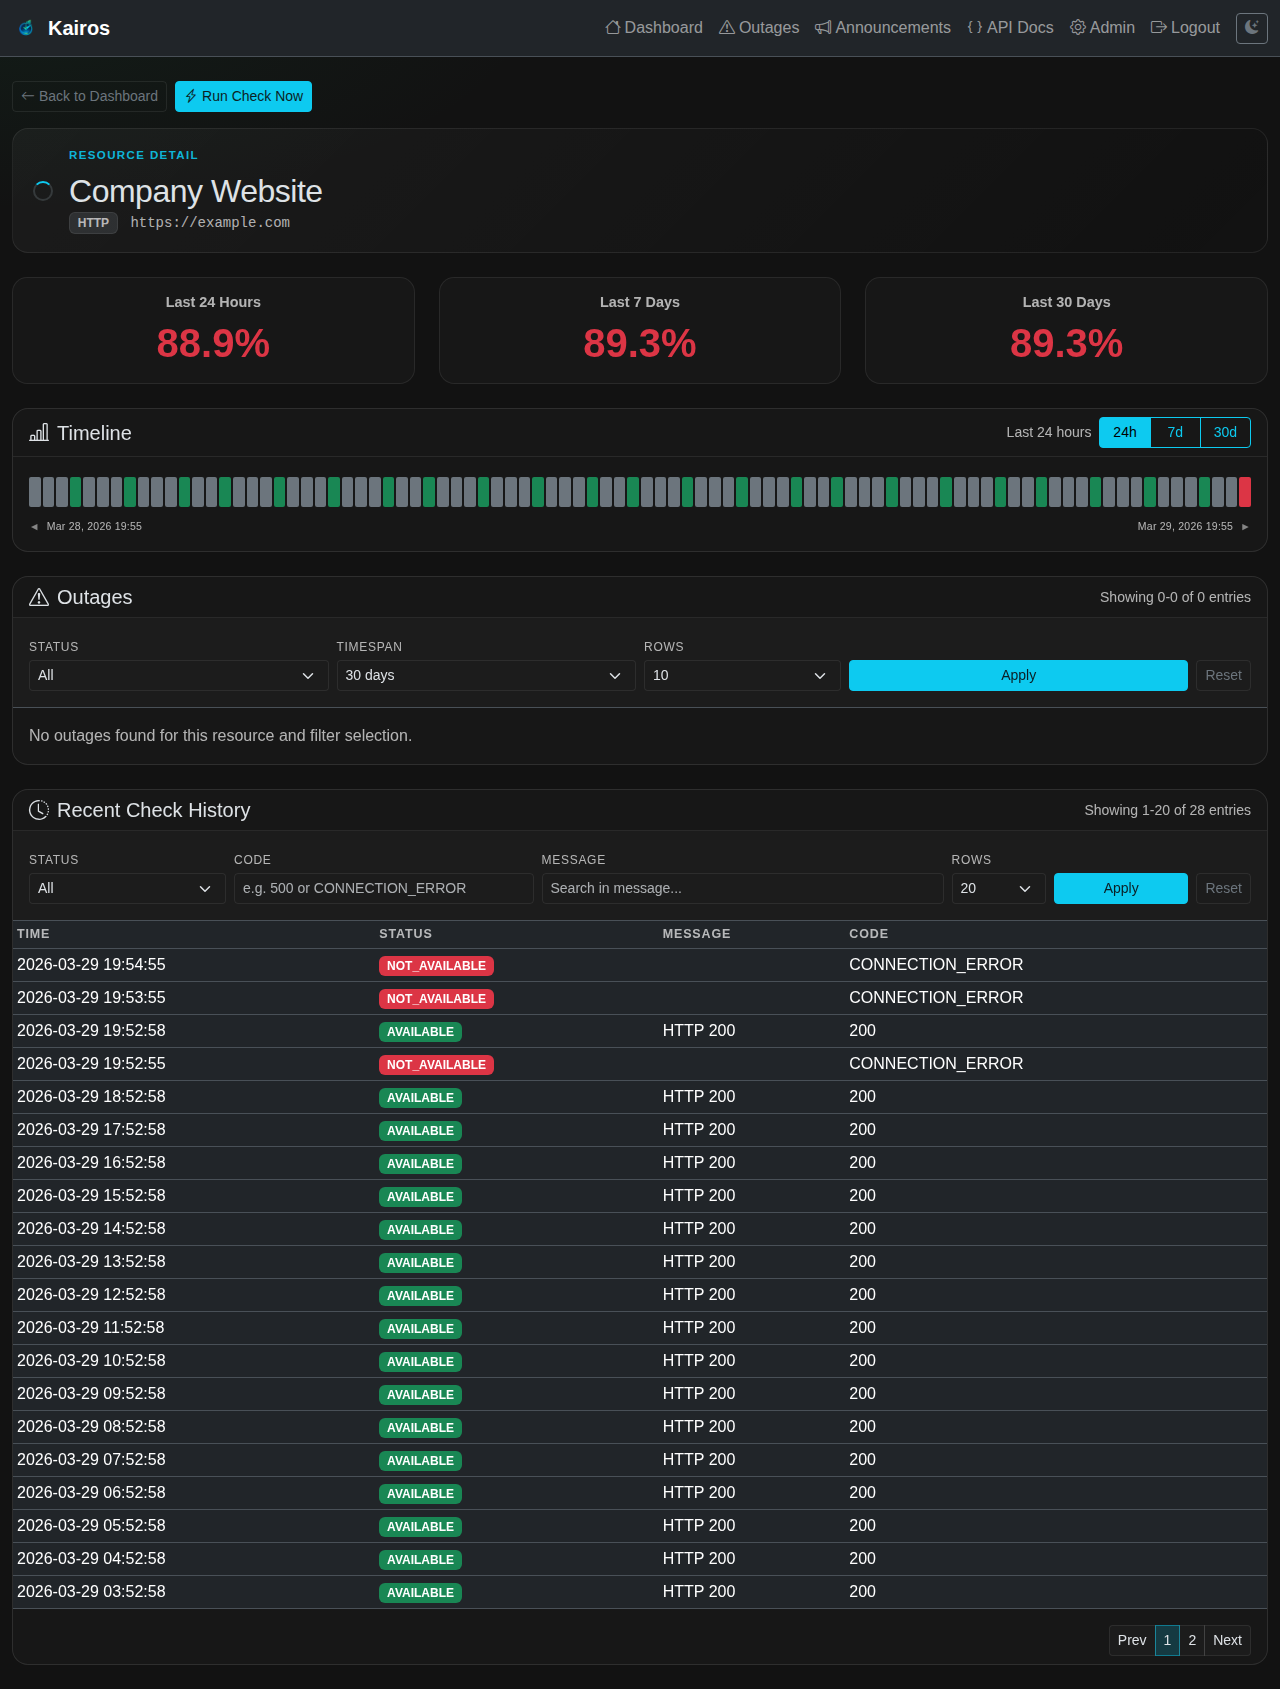 Resource Detail Resource Detail |
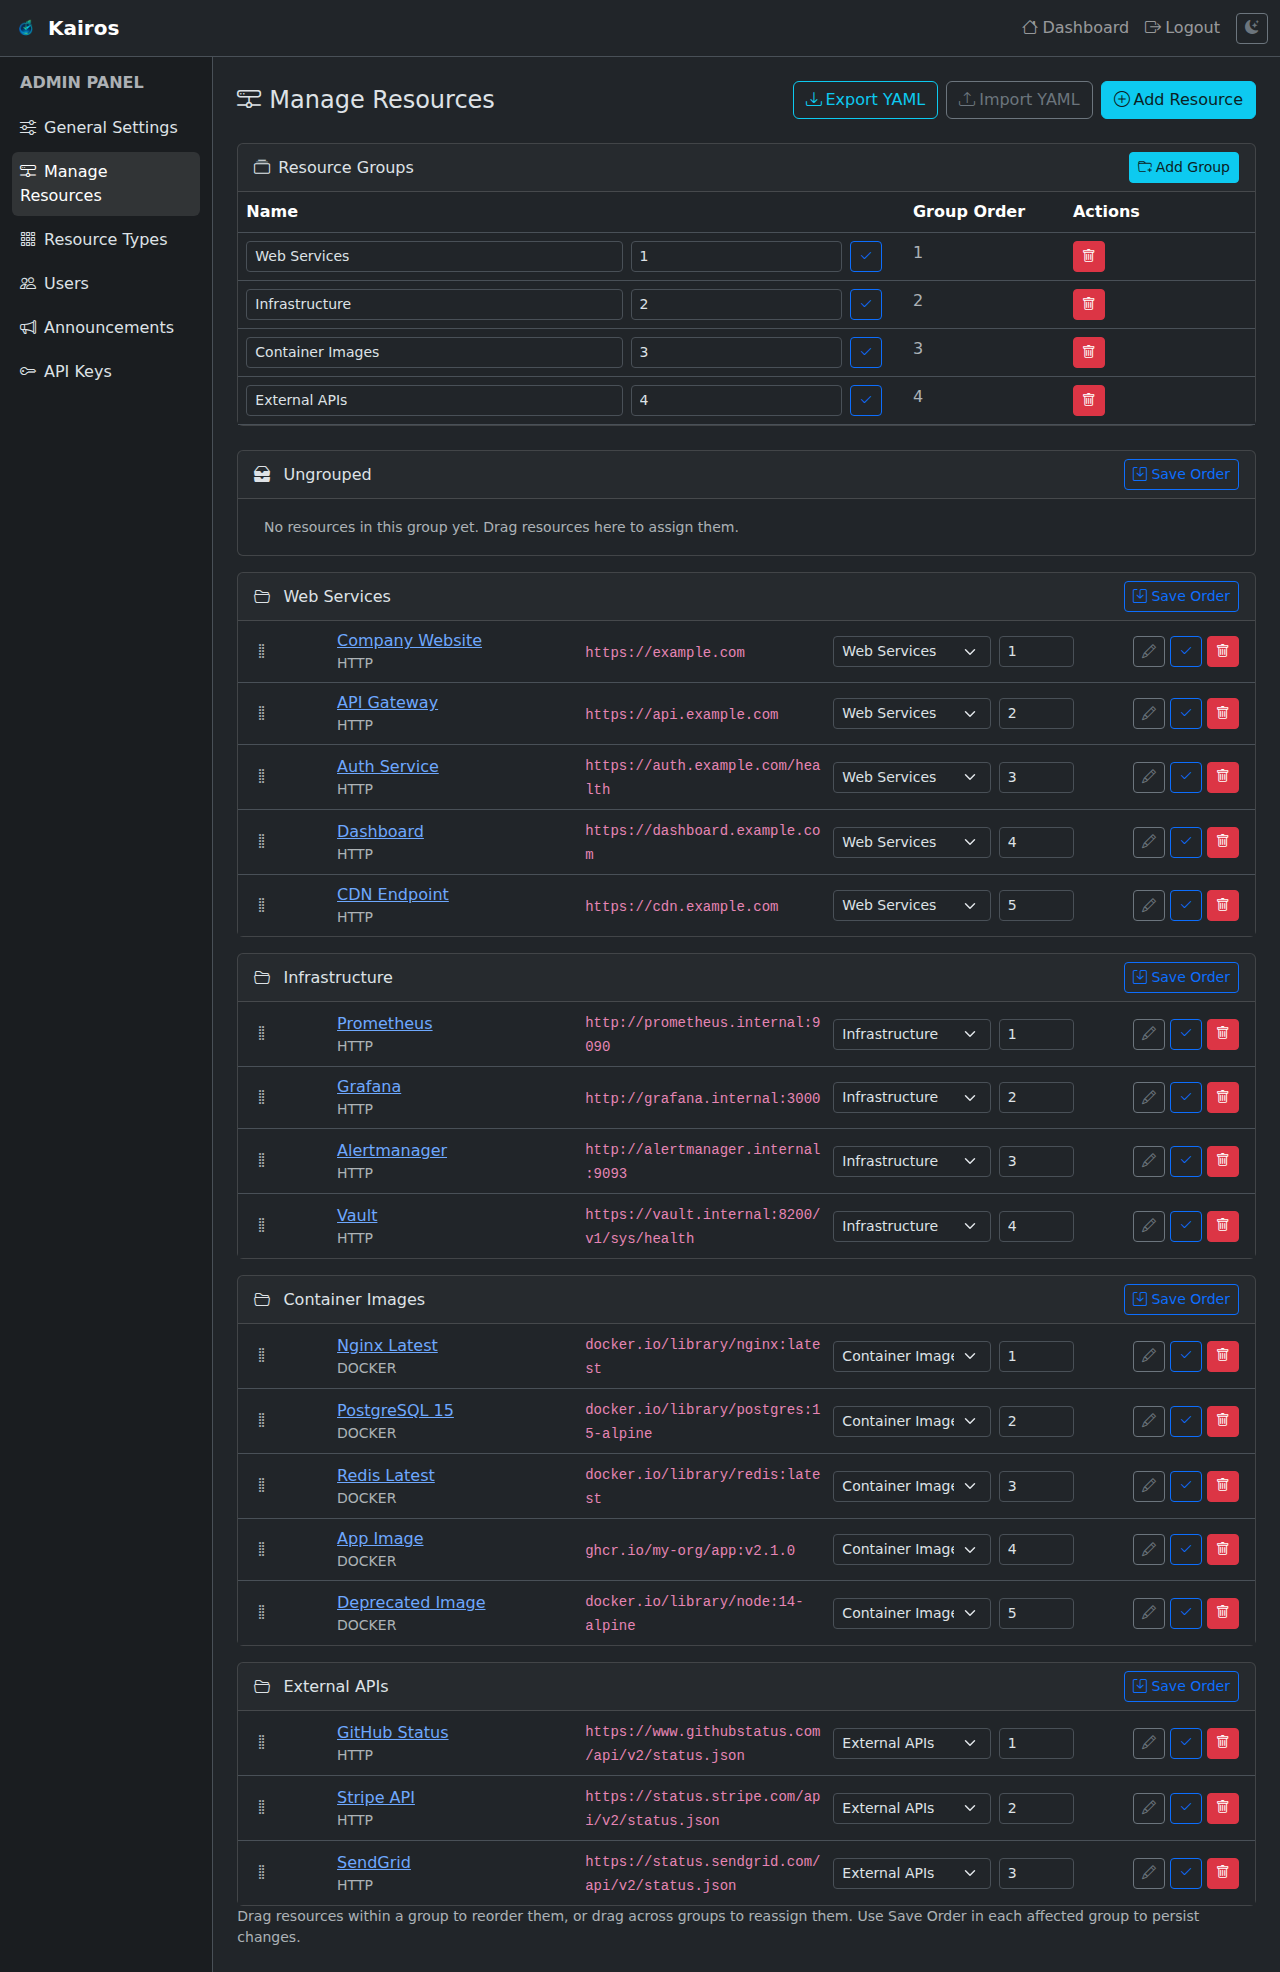 Admin: Manage Resources Admin: Manage Resources |
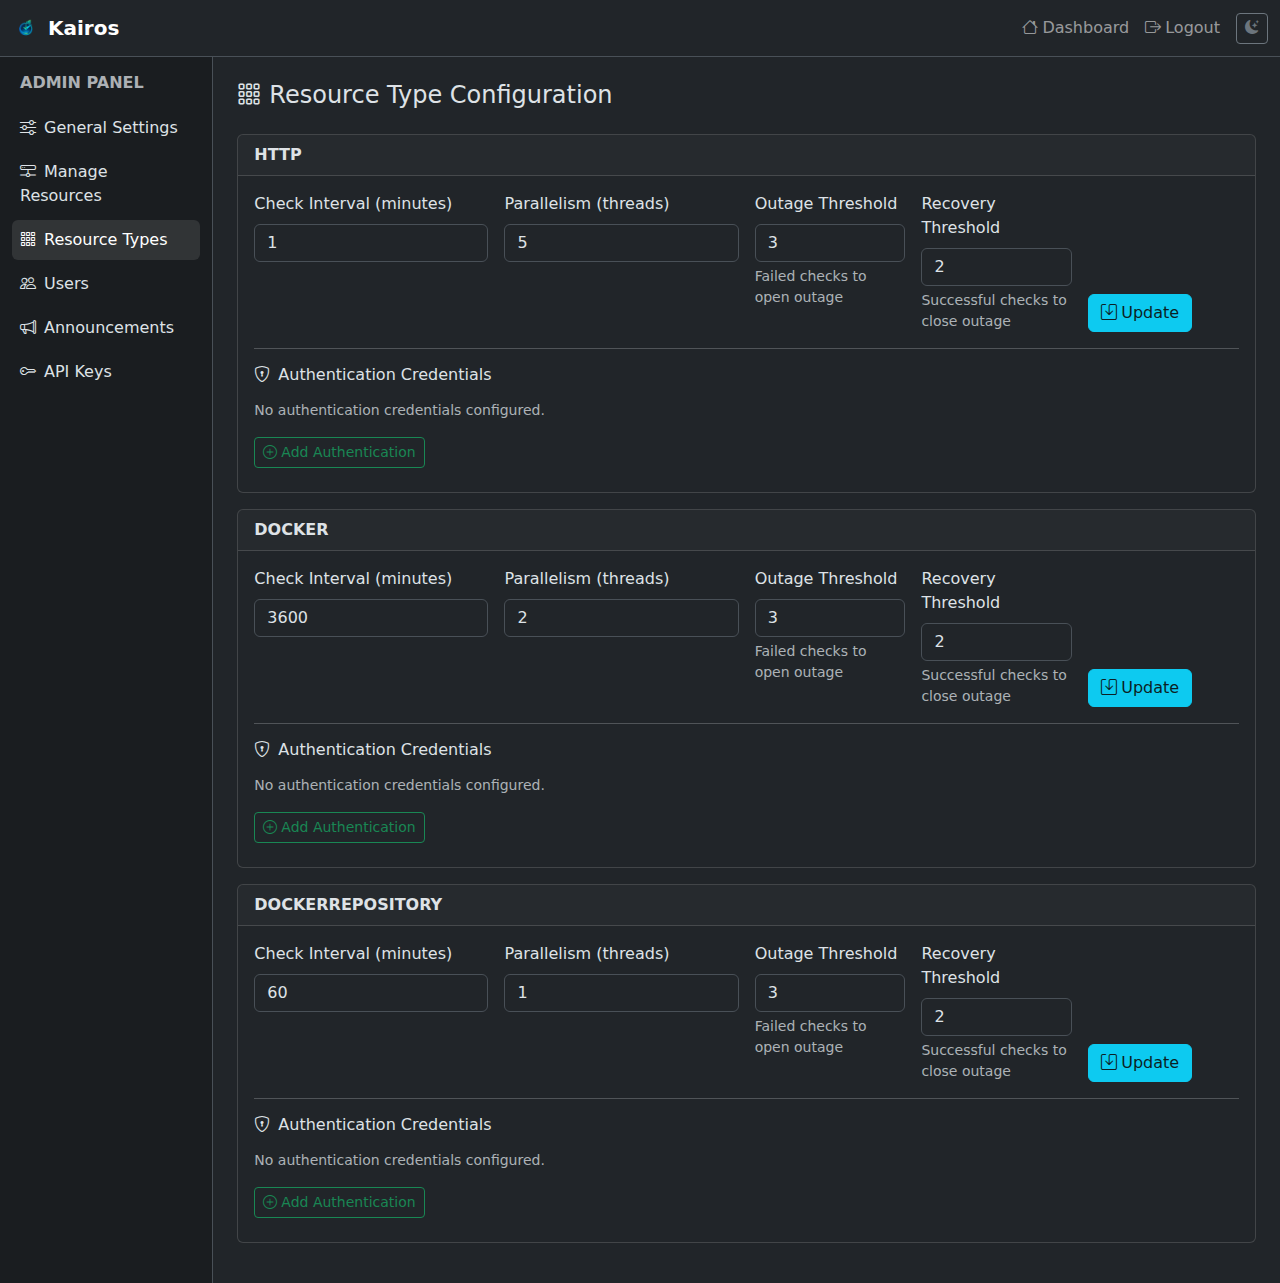 Admin: Resource Types Admin: Resource Types |
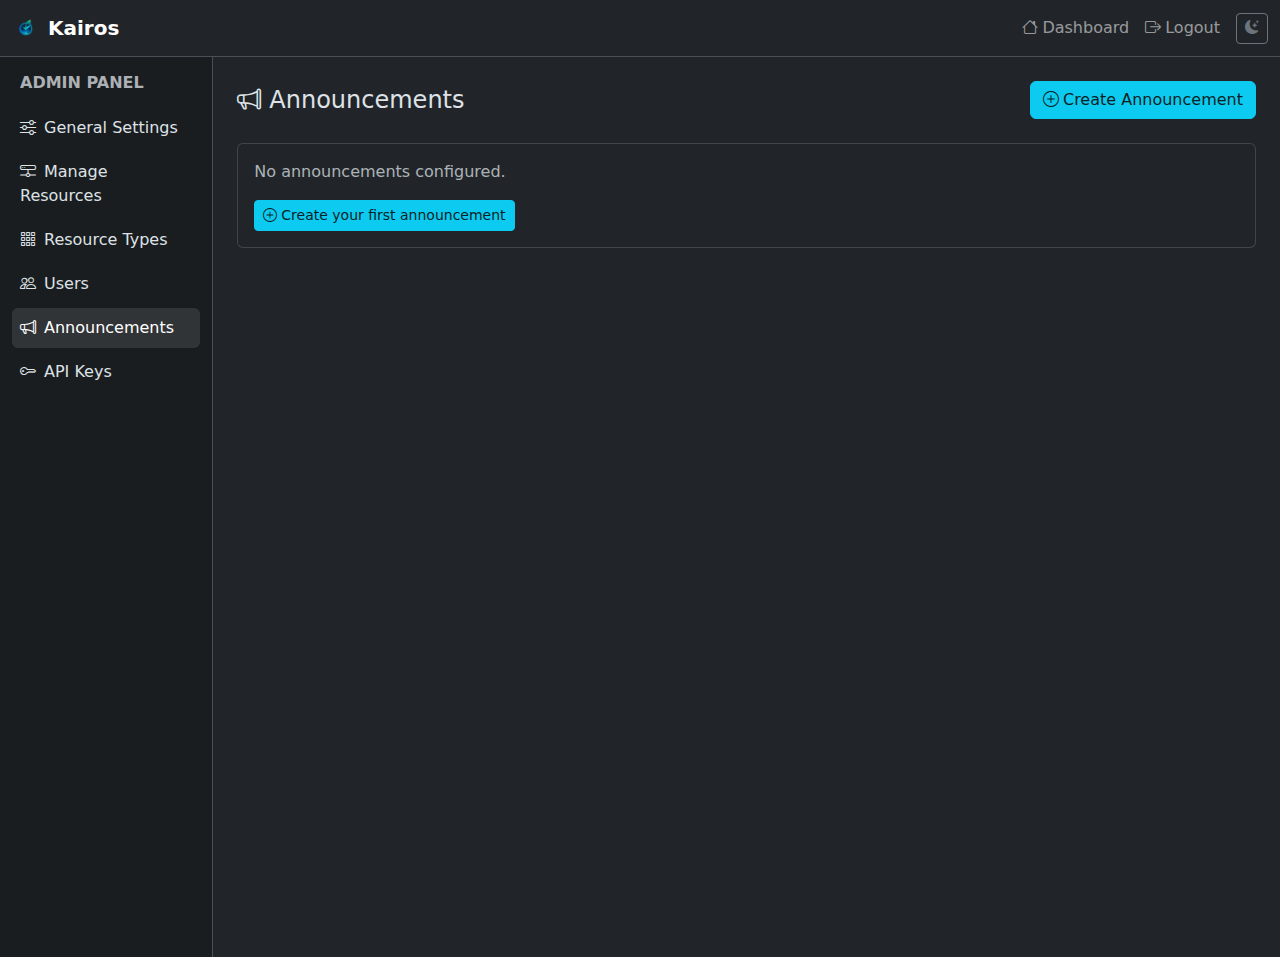 Admin: Announcements Admin: Announcements |
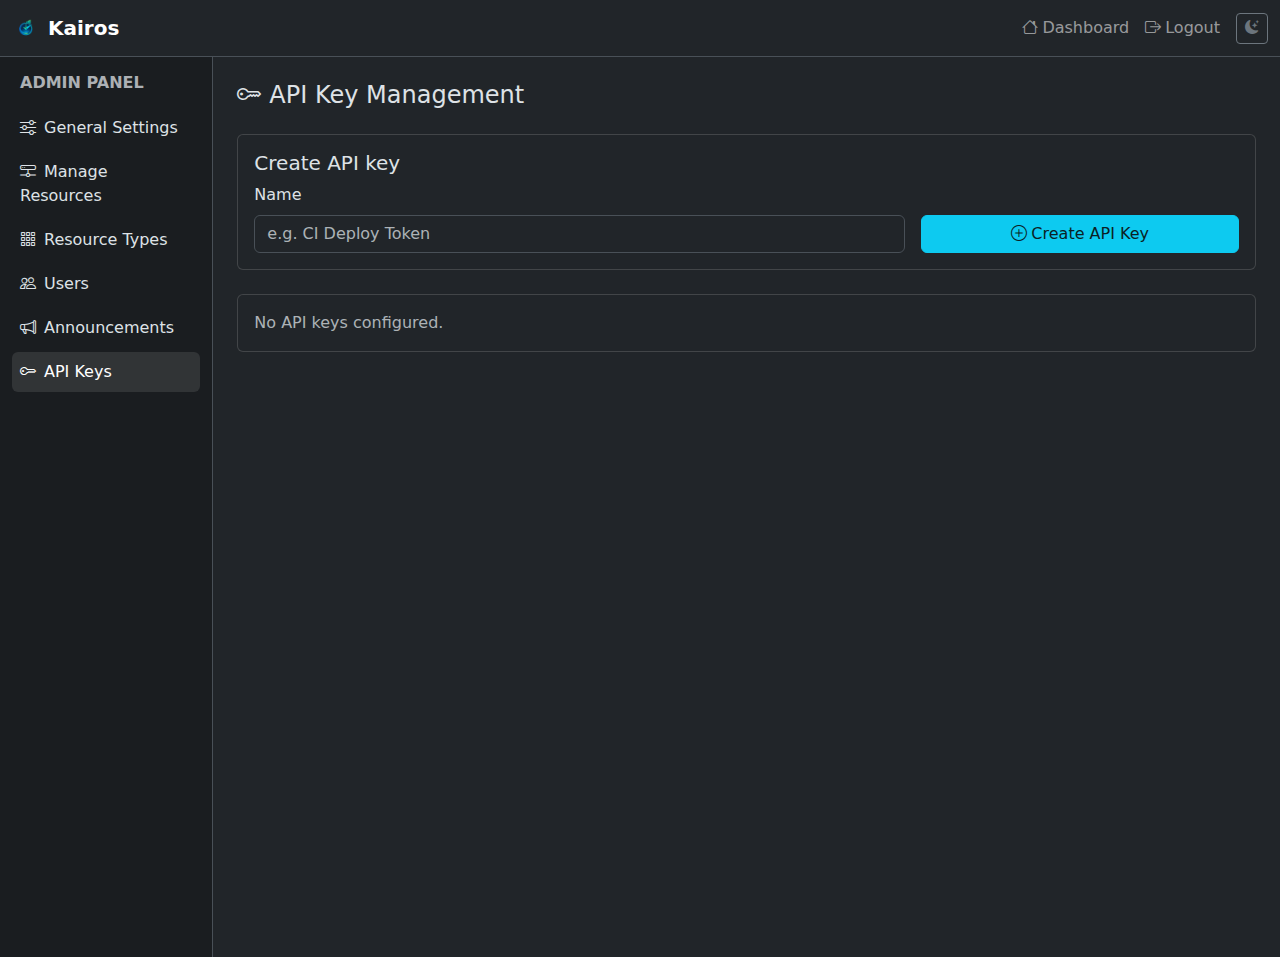 Admin: API Keys Admin: API Keys |
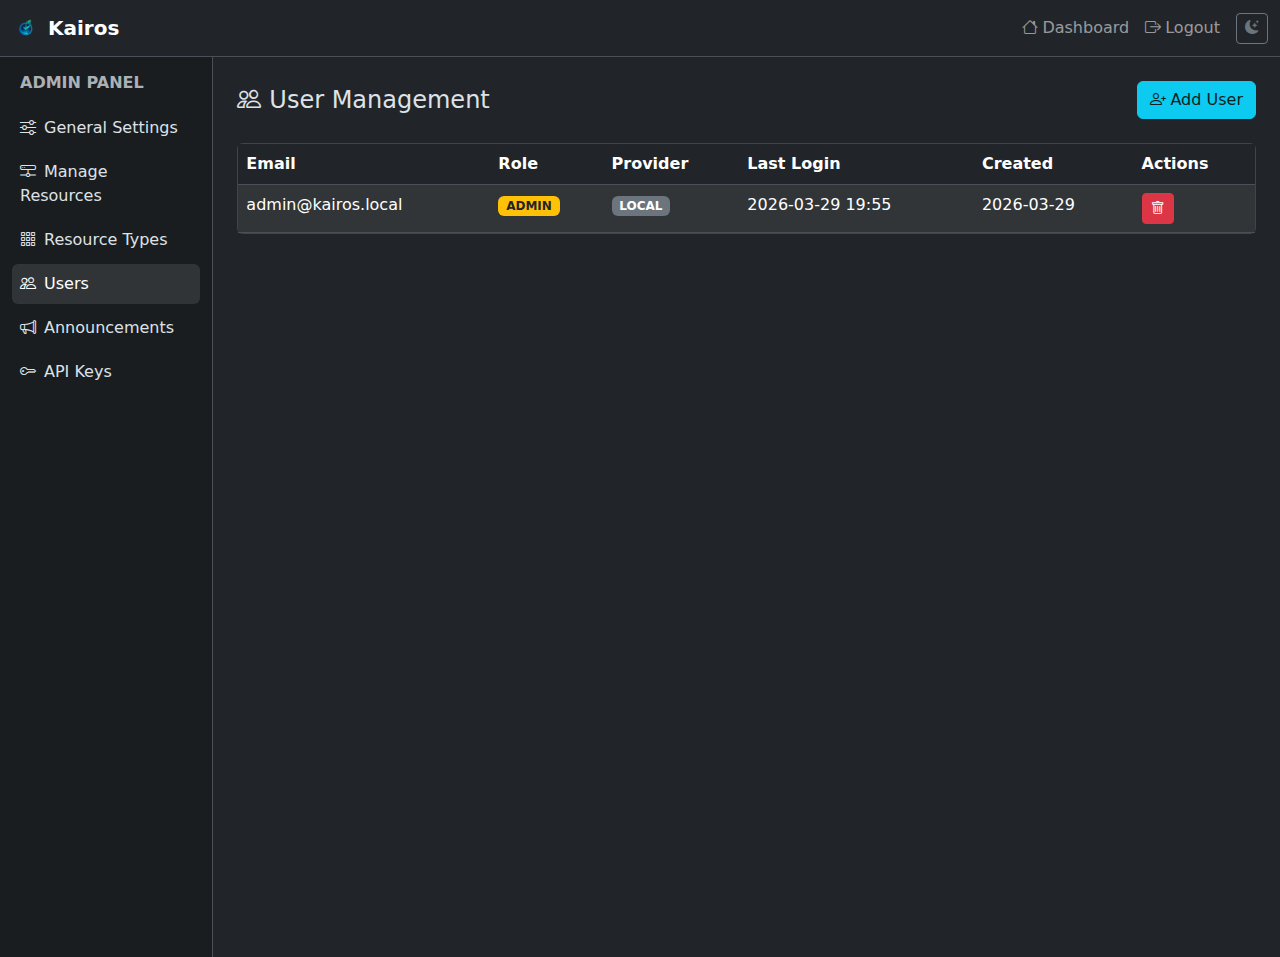 Admin: Users Admin: Users |
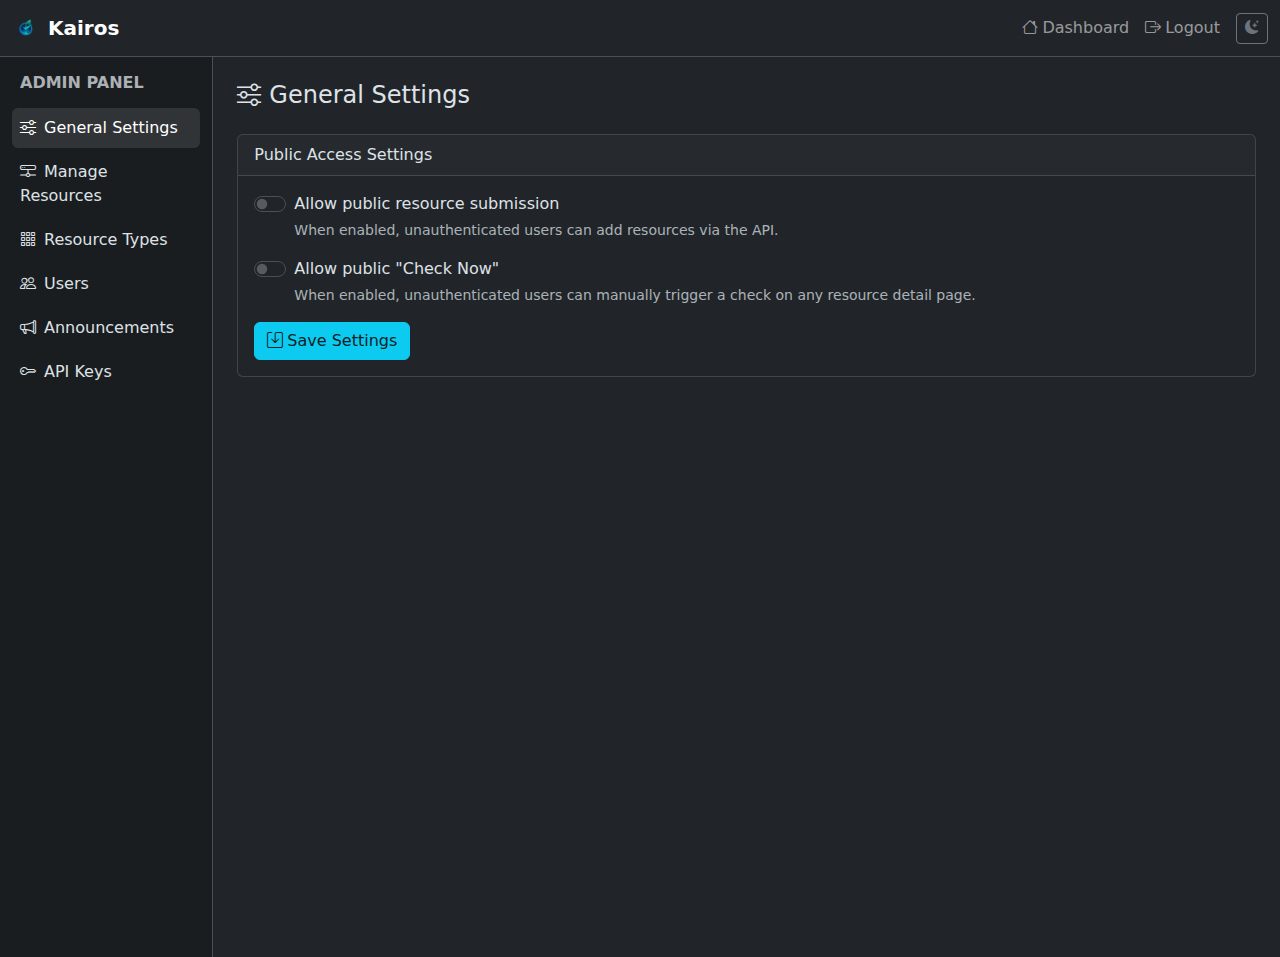 Admin: General Settings Admin: General Settings |
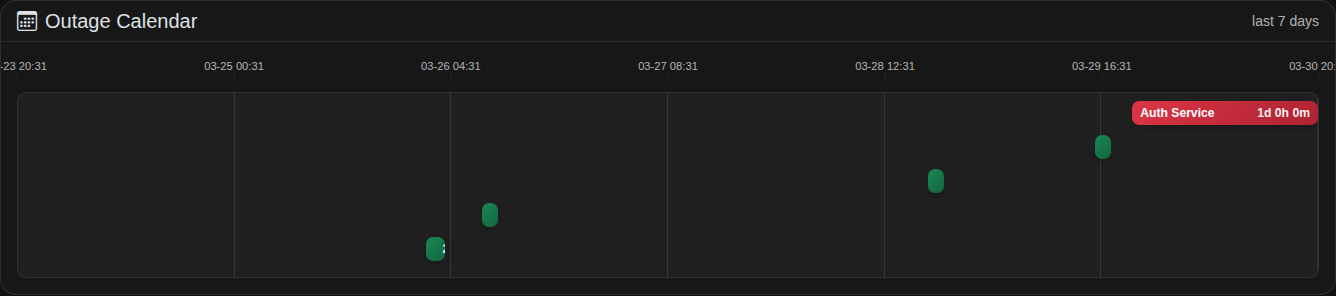 Outages: Calendar Timeline Outages: Calendar Timeline |
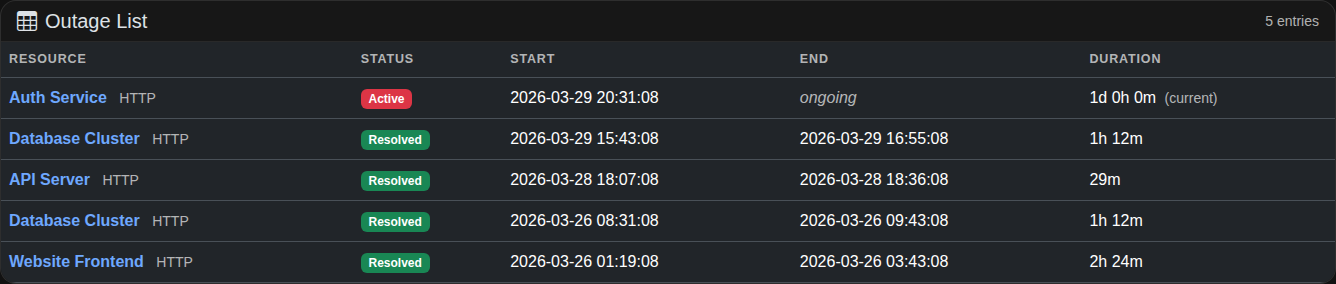 Outages: List Outages: List |
Features
-
Status dashboard - 24-hour timeline, uptime percentages (24 h / 7 d / 30 d), and a full check history per resource with filterable table
-
Resource groups - organise resources into named groups; drag-and-drop reordering within and across groups; a resource can belong to multiple groups simultaneously
-
Group visibility controls - per resource group, choose
PUBLIC,AUTHENTICATED, orHIDDEN; when a resource is in multiple groups the most-permissive visibility wins -
Access mode control - choose between public access and authenticated-only access for all pages via Admin -> General Settings
-
Multi-protocol monitoring - HTTP GET checks, Docker image pullability validation via the OCI/Docker Registry HTTP API (no Docker socket required), and TCP port reachability checks (
host:port); all with configurable intervals and parallelism -
Proxy support - global HTTP and SOCKS proxy configuration with per-protocol enable switches, proxy authentication, and blacklist/whitelist routing rules with wildcard pattern matching so individual targets or whole domain groups can bypass or use the proxy
-
Resource discovery services - configure discovery sources (currently Docker registry/namespace discovery, for example
ghcr.io/wenisch-tech) and Kairos auto-creates/updates Docker resources for discovered images (optional recursive traversal) -
Latency tracking - end-to-end request latency measured per check and broken down into DNS resolution, TCP connect, and TLS handshake phases; stored in the database and displayed as an interactive trend chart on the resource detail page with individual data points, tooltips, zoom (1×–8×), drag-to-pan, and a time axis; also shows latest and average latency per resource on the dashboard; the chart adapts to the selected time range (24 h / 7 d / 30 d) by fetching real per-check samples from the API and downsampling client-side so detail is preserved when zooming in
-
Authentication support - per-resource-type Basic Auth credentials with wildcard URL pattern matching; HTTP checks send an
Authorization: Basic ...header, Docker checks use credentials for registry API/token requests -
Outage tracking - per-resource outage lifecycle from first failure streak to recovery streak, with active outage indicators and live "since" counters in dashboard/resource views
-
Notifications - alert your team when a resource goes down or recovers through multiple built-in channels: Email (SMTP), Discord (rich embeds via webhook), generic Webhook (configurable JSON template), and GitLab Incident Management (automatically opens and closes incidents via the GitLab Issues API); notifications are controlled by flexible policies that can target all resources or specific groups/resources
-
Admin panel - manage resources, tune check intervals and parallelism per resource type, manage users, configure authentication credentials
-
API keys - generate and revoke named API keys for machine-to-machine access to the REST API
-
YAML import / export - export resources from the admin panel and import them again via a versioned, forward-compatible YAML exchange format
-
Announcement system - publish rich-text announcements with three severity kinds (
INFORMATION,WARNING,PROBLEM), active/inactive state, optional auto-expiry (active until), creator and creation timestamp -
Embeddable status widget - expose a lightweight iframe status badge (green/red indicator with status text) and control embedding centrally via Admin -> Embed Widget with policies for disabled, allow-all, or domain allowlist
-
OIDC / OAuth2 login - plug in any OpenID Connect provider (Keycloak, Auth0, etc.)
-
Prometheus metrics -
kairos_resource_statusgauge per resource, exposed at/actuator/prometheus -
Custom headers - inject arbitrary HTML or JavaScript into the
<head>of all pages from the admin panel (analytics tags, custom stylesheets, etc.) -
Dark-mode UI - Bootstrap 5 with Bootstrap Icons, served via WebJars (no CDN dependency)
-
MCP server - built-in Model Context Protocol server (Spring AI, SSE transport) lets AI assistants (Claude, GitHub Copilot, Cursor, etc.) query status, manage resources and announcements, trigger checks, and run instant checks — secured via existing API key authentication
Quick Start
Run with Docker
docker run -d \
  --name kairos \
  -p 8080:8080 \
  -v kairos-data:/app/data \
  ghcr.io/wenisch-tech/kairos:latest
Open http://localhost:8080 in your browser.
Default credentials (created automatically on first start):
| Password | |
|---|---|
[email protected] |
admin |
Warning: Change the default password immediately after first login via Admin -> Users.
Run on Kubernetes with Helm
Kairos includes a production-ready Helm chart for Kubernetes deployments.
Prerequisites
- Kubernetes 1.20+
- Helm 3.0+
Install
helm repo add wenisch-tech https://charts.wenisch.tech
helm repo update
helm install my-kairos wenisch-tech/kairos --version 1.0.4 -n kairos --create-namespace
or install from repository
git clone https://github.com/wenisch-tech/Kairos.git

helm install kairos ./charts/kairos -n kairos --create-namespace
With Persistence (H2 Database)
helm install kairos ./charts/kairos \
  -n kairos --create-namespace \
  --set persistence.enabled=true
With PostgreSQL
helm install kairos ./charts/kairos \
  -n kairos --create-namespace \
  --set env.SPRING_DATASOURCE_URL="jdbc:postgresql://postgres:5432/kairos" \
  --set env.SPRING_DATASOURCE_USERNAME="kairos" \
  --set secrets.SPRING_DATASOURCE_PASSWORD="your-password"
With Ingress
helm install kairos ./charts/kairos \
  -n kairos --create-namespace \
  --set ingress.enabled=true \
  --set ingress.className=nginx \
  --set ingress.hosts[0].host=kairos.example.com \
  --set ingress.hosts[0].paths[0].path=/ \
  --set ingress.hosts[0].paths[0].pathType=Prefix
For more Helm configuration options, see charts/kairos/README.md.
Configuration
Kairos is configured via standard Spring Boot application.properties or environment variables.
| Property | Env var | Default | Description |
|---|---|---|---|
spring.datasource.url |
SPRING_DATASOURCE_URL |
jdbc:h2:file:./kairos |
JDBC URL (H2 file or PostgreSQL) |
spring.datasource.username |
SPRING_DATASOURCE_USERNAME |
sa |
Database username |
spring.datasource.password |
SPRING_DATASOURCE_PASSWORD |
(empty) | Database password |
OIDC_ENABLED |
OIDC_ENABLED |
false |
Enable OIDC / OAuth2 login |
OIDC_CREATEUSERS |
OIDC_CREATEUSERS |
true |
Auto-create Kairos users on first successful OIDC login |
OIDC_CLIENT_ID |
OIDC_CLIENT_ID |
(empty) | OIDC client ID |
OIDC_CLIENT_SECRET |
OIDC_CLIENT_SECRET |
(empty) | OIDC client secret (can be passed directly or via the Helm chart secrets map) |
OIDC_ISSUER_URI |
OIDC_ISSUER_URI |
(empty) | OIDC issuer URI (e.g. https://keycloak.example.com/realms/myrealm) |
See docs/configuration.md for advanced configuration including PostgreSQL setup, Flyway migrations, registry checks, and OIDC.
Documentation
Official Documentation including advanced configuration and information is generated via the markdown files in docs/ folder and published to https://kairos.wenisch.tech .
REST API
The REST API is available at /api. An interactive Swagger UI (auto-generated from the OpenAPI spec) is served at /api - no separate tooling needed.
The raw OpenAPI JSON spec is at /v3/api-docs.
| Method | Path | Auth | Description |
|---|---|---|---|
GET |
/api/resources |
Public | List all active resources |
GET |
/api/resources/{id} |
Public | Get resource details + latest health status |
POST |
/api/resources |
Admin | Add a new resource |
DELETE |
/api/resources/{id} |
Admin | Delete a resource |
GET |
/api/resources/{id}/history |
Authenticated | Full check history for a resource |
GET |
/api/resources/{id}/latency-samples |
Public | Per-check latency samples for a resource (?hours=24|168|720) |
GET |
/api/announcements |
Public | List all announcements |
GET |
/api/announcements/{id} |
Public | Get a single announcement |
POST |
/api/announcements |
Admin | Create an announcement |
PUT |
/api/announcements/{id} |
Admin | Update an announcement |
DELETE |
/api/announcements/{id} |
Admin | Delete an announcement |
See docs/api.md for full request/response examples.
AI Assistant Integration (MCP)
Kairos ships a built-in Model Context Protocol server so AI assistants can query and manage it in natural language. The MCP server is secured with your existing API keys.
Connect Claude Code
claude mcp add kairos \
  --transport sse \
  --url http://localhost:8080/sse \
  --header "X-API-KEY: your-api-key"
Connect GitHub Copilot (VS Code)
Add the following to your VS Code settings.json:
{
  "mcp": {
    "servers": {
      "kairos": {
        "type": "sse",
        "url": "http://localhost:8080/sse",
        "headers": {
          "X-API-KEY": "your-api-key"
        }
      }
    }
  }
}
Example Prompts
Once connected, you can use natural language to interact with Kairos:
| Goal | Example prompt |
|---|---|
| Get an overview | "What is the current status of all monitored resources?" |
| Investigate a failure | "Which resources are currently down, and when did they go down?" |
| Add a resource | "Add a new HTTP monitor for https://api.example.com called 'Production API'." |
| Remove a resource | "Delete the resource named 'Staging DB'." |
| Trigger an immediate check | "Run an instant check on https://example.com." |
| Check history | "Show the last 10 check results for the resource named 'GitHub'." |
| Post an announcement | "Create a WARNING announcement: 'Scheduled maintenance on Saturday 08:00–10:00 UTC', active until 2026-06-07T10:00:00." |
| Active outages | "Are there any active outages right now? Give me details." |
See docs/mcp-server.md for the full tool reference and advanced configuration.
Monitoring with Prometheus
Kairos exposes a Prometheus-compatible endpoint at /actuator/prometheus. The key metric is:
kairos_resource_status{resource_name="GitHub",resource_type="HTTP"} 1.0
Values: 1 = available, 0 = not available, -1 = unknown (no checks yet).
A health endpoint is also available at /actuator/health.
Development
Prerequisites
- Java 25+
- Maven 3.8+
- Network access to target Docker/OCI registries if you want Docker image checks
Run from source
git clone https://github.com/wenisch-tech/Kairos.git
cd Kairos

# Run tests
./mvnw test

# Run with H2 console enabled (default - open http://localhost:8080/h2-console)
./mvnw spring-boot:run
Build a JAR
./mvnw package -DskipTests
java -jar target/kairos.jar
License
Licensed under AGPL v3.0 by Jean-Fabian Wenisch / wenisch.tech wenisch.tech
No comments yet
Be the first to share your take.