
enola - cross-repo architecture intelligence for AI coding agents
Deterministic code analysis across every repository in your system, served to your AI agent over MCP. Your real architecture - extracted from source, not guessed, not embedded, not summarized.
enola is a local Model Context Protocol (MCP) server for code architecture analysis. Point it at a repository and it builds a precise graph of your code's structure - modules, types, routes, storage, dependencies, and how they all connect - straight from your source, and exposes tools your agent can use to traverse and query it.
Then point it at the next repository, and the next. That's where enola stops resembling anything else you've tried.
One graph across your whole system
Your architecture doesn't stop at a repo boundary; your tooling usually does. A frontend, a backend, and a mobile app in three repos are three blind spots for an AST parser, a language server, or a vector index - each of them sees one repo at a time, and the most consequential dependency in your system is the one that crosses between them.
enola links per-repo graphs into one queryable graph. It resolves:
- a web client's
fetch()/ axios / openapi-fetch call to the backend route that serves it; - an iOS endpoint enum or an Android Retrofit interface to the same route, from an entirely different language;
- a gRPC client call site - Go, TypeScript, Python, connect-rpc or grpc-web - to the
.protoservice that implements it; - an asynchronous hop no call graph can see: one service's Kafka producer to the other service's consumer;
- shared-library imports between repos that depend on each other's code directly.
The hard part isn't finding the call - it's making the two sides match. A route registered as HandleFunc("/courses", …) inside a function that receives a PathPrefix("/api") subrouter from its caller doesn't actually live at /courses; it lives at /api/courses, and unless you compose that prefix interprocedurally, across function and package boundaries, the client call never resolves. The same is true of Axum's .nest(), Rails' scope/namespace/shallow nesting, and a Swift endpoint enum whose version prefix is defined in a protocol extension three files away. A large share of enola's extractor engineering (internal/engine/cache.go reads as the changelog of it) is exactly this work: getting each side to its true runtime path so the link is real rather than plausible.
What that buys your agent is the class of question that actually carries risk: if I change this endpoint, which mobile screens break? Which of our backend routes does no client call anymore? Which service consumes the events this one publishes? Answers, from a traversal - not an inference.
Feedback after the edit, not just context before it
So before your agent writes a line of code, it already knows the shape of the thing it's editing. And after the edit, it can check its own work: pin a baseline, make the change, re-snapshot, and diff_snapshot reports the architectural delta - the coupling that appeared, the cycle that got introduced, the symbols added and removed. When an agent quietly does something structurally wrong, that delta is what catches it, in time to steer the next prompt toward a fix instead of discovering it in review three days later.
Both ends of that loop are auditable. Every snapshot emits a receipt whose ID is a content fingerprint - sha256 over the fact bytes, not a random UUID - so two runs on the same commit produce the same ID, provably. And the built-in localhost dashboard shows you the receipt, the graph, the findings, and the extraction quality behind them, so "trust me, it's deterministic" is something you can actually look at.
enola is architecture intelligence: it saves your agent tokens, and it saves you the rework. It works on a single repo. It's built for the ones that span several.
TL;DR - try it in 30 seconds
1. Install
curl -fsSL https://raw.githubusercontent.com/enola-labs/enola/main/install.sh | sh
export PATH="$HOME/.local/bin:$PATH" # if not already on PATH
2. Connect to your agent
Claude Code:
claude mcp add enola enola
Cursor (add to mcp.json):
{
  "mcpServers": {
    "enola": { "command": "enola" }
  }
}
GitHub Copilot / VS Code (add to .vscode/mcp.json):
{
  "servers": {
    "enola": { "command": "enola" }
  }
}
3. Ask it to map your project
"Generate an architectural snapshot of /path/to/my/project"
4. Add the repos it talks to
"Now snapshot /path/to/the/backend with append mode"
Done. Your agent has a precise structural map of your code - and, with two or more repos loaded, of the calls that cross between them. For configuration options and what to ask next, see Quick start below.
Supported languages: Go · JavaScript · TypeScript · Python · Java · Kotlin · Swift · Ruby · Rust · C · C++ · PHP · Vue · Svelte · OpenAPI · gRPC - with framework awareness (Next.js, Nuxt, SvelteKit, FastAPI, Django, Spring, Rails, Laravel, Symfony, SwiftUI, Jetpack Compose, WordPress, Kafka, …)
Why enola
AI coding agents are powerful, but they're non-deterministic. On every task they re-discover your codebase from scratch - grepping, opening files, inferring how things fit together - and they get it subtly wrong often enough to matter. That guessing costs you tokens (re-reading the same files, every session) and, far more expensively, time: the wrong turn, the re-prompt, the refactor that has to be redone because the agent didn't know what depended on what.
enola removes the guessing from the part that should never be guessed: the structure. It does that at both ends of a task.
Before the edit - the agent starts from facts. It gets a deterministic architecture graph of your code's real types and relationships, built by parsers and graph algorithms, not by a language model. The structure is extracted from your source, not summarized from it; these are facts, not notes. impact_analysis returns the exact transitive dependent set of what's about to change, across repos. No guessing about blast radius, no missed caller.
After the edit - the agent gets feedback and corrects itself. This is the part most tooling has no answer for. Pin a baseline with set_baseline, let the agent work, re-snapshot, and diff_snapshot reports what the change actually did to the architecture: findings newly introduced or resolved, coupling added or removed, symbols added or removed. It's a delta, not a linter - it stays silent about everything that was already there - so when it does speak, the agent has a concrete, structural reason to go back and refactor. The agent stops having to claim it built what you asked for; the graph shows it.
And you can audit the whole thing. Every snapshot carries a receipt: enola version, git ref (and whether the tree was dirty), extractors used, fact and insight counts, extraction-quality metrics, and a snapshot ID that is a sha256 content fingerprint rather than a random UUID. compare_receipts will tell you whether two snapshots are even comparable before you trust a diff between them. The dashboard puts all of it on one localhost page. Determinism you can't inspect is a marketing claim; determinism with a receipt is an engineering property.
The result is the difference between vibe coding - prompt, hope, fix - and AI-augmented engineering: fewer wrong turns, fewer tokens burned, and work you can reproduce. enola adds determinism where AI lacks it, so your agent spends its intelligence on the actual problem instead of re-learning your repo.
The savings show up in two currencies. Tokens are the obvious one: a graph query costs a fraction of the file-reading it replaces. Time is the bigger one - work that doesn't have to be redone because the agent knew the blast radius before it started, and knew it had gone wrong before you did. And past a certain size the comparison stops being about cost at all: linking an 8-repo ecosystem means holding 10M+ tokens of source at once, so those cross-repo edges aren't expensive to find by grepping, they're unreachable by grepping. enola --status (and --status --all, per repository) reports both currencies, priced against what an agent would have had to ingest instead - measured corpus sizes and real call counts recorded under ~/.enola/usage/. It's an estimate, clearly labelled as one, and documented in full - but it's counted from what your agents actually did, not from a brochure.
📖 Want the why before the what? The most boring file in enola is the story of why enola exists at all, and the design decision the whole thing rests on. It's the best place to start.
enola is a first step, not a replacement. It runs before your agent explores, so it knows where to look and what connects to what. It doesn't replace grep, file reading, or code search - it makes them precise.
Isn't this just another AST parser?
Fair question - plenty of tools parse an AST. enola does too, at stage 2 of an 8-stage pipeline (ARCHITECTURE.md → The pipeline). Parsing is the entry point, not the product.
| AST / tree-sitter / LSP / RAG gives you… | enola gives you… |
|---|---|
| a syntax tree, one file at a time | a typed, directed graph resolved across files, languages, and repos |
foo.bar() as a call to an unknown token |
foo.bar() resolved to the exact declaring symbol - through dispatch, inheritance, and imports |
| edges exactly as written in source | edges made semantically complete - synthetic has_method, module→import bridges, cross-repo links |
| similar chunks, ranked by embedding distance | exact answers: "what transitively depends on this?", with accurate totals |
| no way to tell a leaf from a blind spot | a genuine leaf service told apart from a coverage gap |
| text you re-grep and re-infer every session | a byte-identical, content-fingerprinted snapshot |
| a view of the code as it is | a diff of what your change did to the architecture |
The gap a parser can't cross is resolution: enola resolves foo.bar() to the symbol that actually declares bar - through Ruby send, Swift inherited-method chains, Kotlin callable references, Python absolute imports, Java FQN indexing - then links per-repo graphs so a web client's HTTP or gRPC call reaches the backend route that serves it. The gap a vector index can't cross is exactness: retrieval returns what looks relevant, traversal returns what is connected.
📖 Parsing code is not mapping architecture - the long-form argument behind this table.
What it is
Under the hood, enola models your codebase as a graph of architectural types - which we call kinds - and the relations between them. That's the whole concept: not a magic "knowledge graph," not embeddings, just a deeply technical, structural model of what your code actually contains - a code architecture graph built by static analysis and served to your agent over MCP.
The kinds (the nodes):
- module - a package or directory
- symbol - a function, method, struct, interface, type, class, or constant
- route - an HTTP/API endpoint
- storage - a database table, data store, or messaging topic
- dependency - an import relationship
- service - a whole repository (used when you analyze several at once)
The relations (the edges) connect them: declares, imports, calls, implements, depends_on, and more. Because the edges are typed and directed, the graph is queryable, not merely searchable - you compute over it. On top of it, enola builds a small set of tools your agent can call to answer real structural questions with exact answers.
Getting to that graph is where the pipeline earns its keep. AST parsing is one stage; the rest is what makes the result queryable: parse → normalize into the typed fact model → link across repos (with 2+ loaded) → build a bidirectional graph index with synthetic edges → run deterministic explainers → emit a provenance receipt (ARCHITECTURE.md → The pipeline). The explainers are real graph algorithms, not regex heuristics - Tarjan's SCC for dependency cycles, cycle-safe longest-path for dependency depth, statistical (mean + 2σ) outlier tests for god-classes, hotspots, and complexity - and each finding carries a confidence score, where 1.0 means a structural fact and anything below is a flagged heuristic (ARCHITECTURE.md → Insights (explainers)).
For the full mental model and internals, see ARCHITECTURE.md.
Who it's for
Everyone above the keyboard needs the same thing enola produces: a structural map of the system that's actually correct, and a way to tell whether a change respected it. Because the graph is deterministic and derived from source, an agent can turn it into an always-accurate architecture diagram on demand - a mermaid module graph, a cross-repo dependency map - and it matches the code every time, and again next quarter, byte for byte. (enola doesn't draw the diagram; it hands your agent the facts to draw it from, so the picture is never the stale one on the wiki.)
- Developers pairing with an AI coding agent - Claude Code, Cursor, GitHub Copilot, Opencode, Windsurf, Zed, or any MCP-compatible tool. The agent starts from your real structure instead of re-guessing it every task - and finishes by proving what it changed.
set_baselinebefore,diff_snapshotafter: if the agent introduced a dependency cycle, coupled two modules that had no business knowing about each other, or quietly grew a god class, that shows up as a delta you can hand straight back to it as the next prompt. Self-correction beats re-review. - Teams working across multiple repos - a backend, a web frontend, a mobile app. enola links them into one cross-repo dependency graph so an agent can follow a call from the web client all the way into the service that answers it - including the asynchronous hop a call graph can't see, where one service consumes the Kafka events another produces. And because that's a real graph rather than a fixed set of features, questions you'd otherwise reach for a dedicated tool to answer become plain queries over it - which of the backend's endpoints does no client app call? among them, a cleanup shortlist derived from the same client→server links (verify against callers outside the snapshot - cron jobs, webhooks, third-party consumers - before deleting).
- Anyone about to refactor - know the blast radius before touching code with
impact_analysis, and know what your refactor actually did after, withdiff_snapshot. A large refactor usually fails in one of two ways: you missed a caller, or you moved the mess rather than removing it. The first is a traversal; the second is a delta. Both are answers, not opinions. - Anyone reviewing AI-written code - the hardest question in an agent-heavy workflow isn't "does it work?", it's "did it change the architecture in a way nobody asked for?"
diff_snapshotanswers exactly that, and only that: it reports what moved, never pre-existing state, so a clean diff is genuinely a clean bill of structural health rather than a wall of noise you learn to ignore. - Architects - the structural view you usually maintain by hand, computed from the code instead of a diagram that drifts out of date: dependency cycles, layer violations, call-graph hotspots, cross-repo coupling, and dependency depth - plus a module/dependency diagram an agent regenerates from the current commit, so the picture stays honest. Pin a baseline at the start of a migration and every diff afterwards tells you whether the codebase is moving toward the target architecture or away from it.
- Engineering leaders - CTOs, VPs, and managers - a trustworthy picture of a codebase's shape for planning, onboarding, and risk. Deterministic signals (cycles, hotspots, coupling) instead of gut feel, a new-hire tour or a deck diagram that matches reality, a map that's reproducible run to run - so two people looking at it see the same thing - and, via
--statusand the dashboard, a running tally of what the tooling has actually saved across every repo your team points it at - priced against the reconstruction it replaced, by a model that is written down and arguable rather than asserted.
The MCP tools (and how they work together)
enola serves 13 MCP tools over stdio, and the workflow is simple: generate the snapshot once, then ask. These aren't text lookups - each tool computes over the graph: traverse walks reachability, find_path finds the shortest chain between two points, impact_analysis takes the transitive reverse closure. They cover three jobs, and the table below is ordered by them: understand the code, plan a change, verify the change.
| Tool | The question it answers |
|---|---|
generate_snapshot |
"Snapshot this repo." Build or refresh the graph. Run it first; use append to add more repos. |
explore |
"What's in this module/file/symbol, and what touches it?" A guided tour. |
query_facts |
"List exactly these." Every route, every interface, every external dependency. |
query_insights |
"What did the analysis find?" Fetch the computed findings - unused routes, cycles, god-classes - instead of re-deriving them. |
show_symbol |
"Show me the code." Jump straight to a symbol's source. |
traverse |
"What does X depend on?" / "What depends on X?" Walk the graph. |
find_path |
"How does A reach B?" The call or dependency chain between two points. |
impact_analysis |
"If I change X, what breaks?" The blast radius of a change. |
coverage_report |
"Which cross-repo edges did enola resolve vs. miss?" Tell a genuine leaf service from a coverage gap. |
set_baseline |
"Remember the architecture as it is now." Pin a baseline before you start editing. |
diff_snapshot |
"What did my change actually do?" The architectural delta vs. the baseline - new findings, new coupling, added/removed symbols. Warns if the two snapshots aren't comparable. |
snapshot_receipt |
"What was this graph generated over, and how complete is it?" Provenance (version, git ref + dirty, snapshot ID, output hashes) plus extraction-quality metrics. |
compare_receipts |
"Are these two snapshots even comparable?" A comparability verdict + metric deltas - the gate before trusting a diff, and a signal for improving coverage. |
impact_analysis is the one to know. Before a refactor, it computes the full set of code that transitively depends on what you're about to change - grouped by how many hops away it is, and aware of cross-repo dependencies. Instead of your agent guessing what a change might affect (and missing things), it gets the exact dependent set. That's determinism turned into a concrete payoff: safer changes, planned in the right order, the first time.
diff_snapshot closes the loop on the edit itself - this is the feedback your agent doesn't otherwise get. Where impact_analysis plans a change, diff_snapshot verifies it:
generate_snapshot → set_baseline → (agent edits) → generate_snapshot → diff_snapshot
It reports the architectural diff: regressions introduced (findings that newly appeared and have a structural cause in what you touched), improvements (findings resolved), findings whose content moved, new and removed coupling edges, and added/removed/changed facts. It is a delta, not a linter - it stays completely silent about pre-existing state, so a pattern that was already there before and after never fires, and a clean diff means something. A line-number shift is not a change. Findings that merely drifted across a statistical threshold without a structural cause are separated out as incidental, so a real regression never hides in noise. And if the baseline isn't safely comparable - different repo, different enola version, a different extractor set, a baseline more than three days stale - the diff says so at the top instead of quietly lying to you.
That turns "did the agent do what it said?" from a re-read of every touched file into one deterministic answer. The server nudges the agent toward the loop on its own: after a snapshot it tells the agent to pin a baseline if there isn't one, and to run diff_snapshot if there is.
See ARCHITECTURE.md for every tool's full parameters.
See it in action
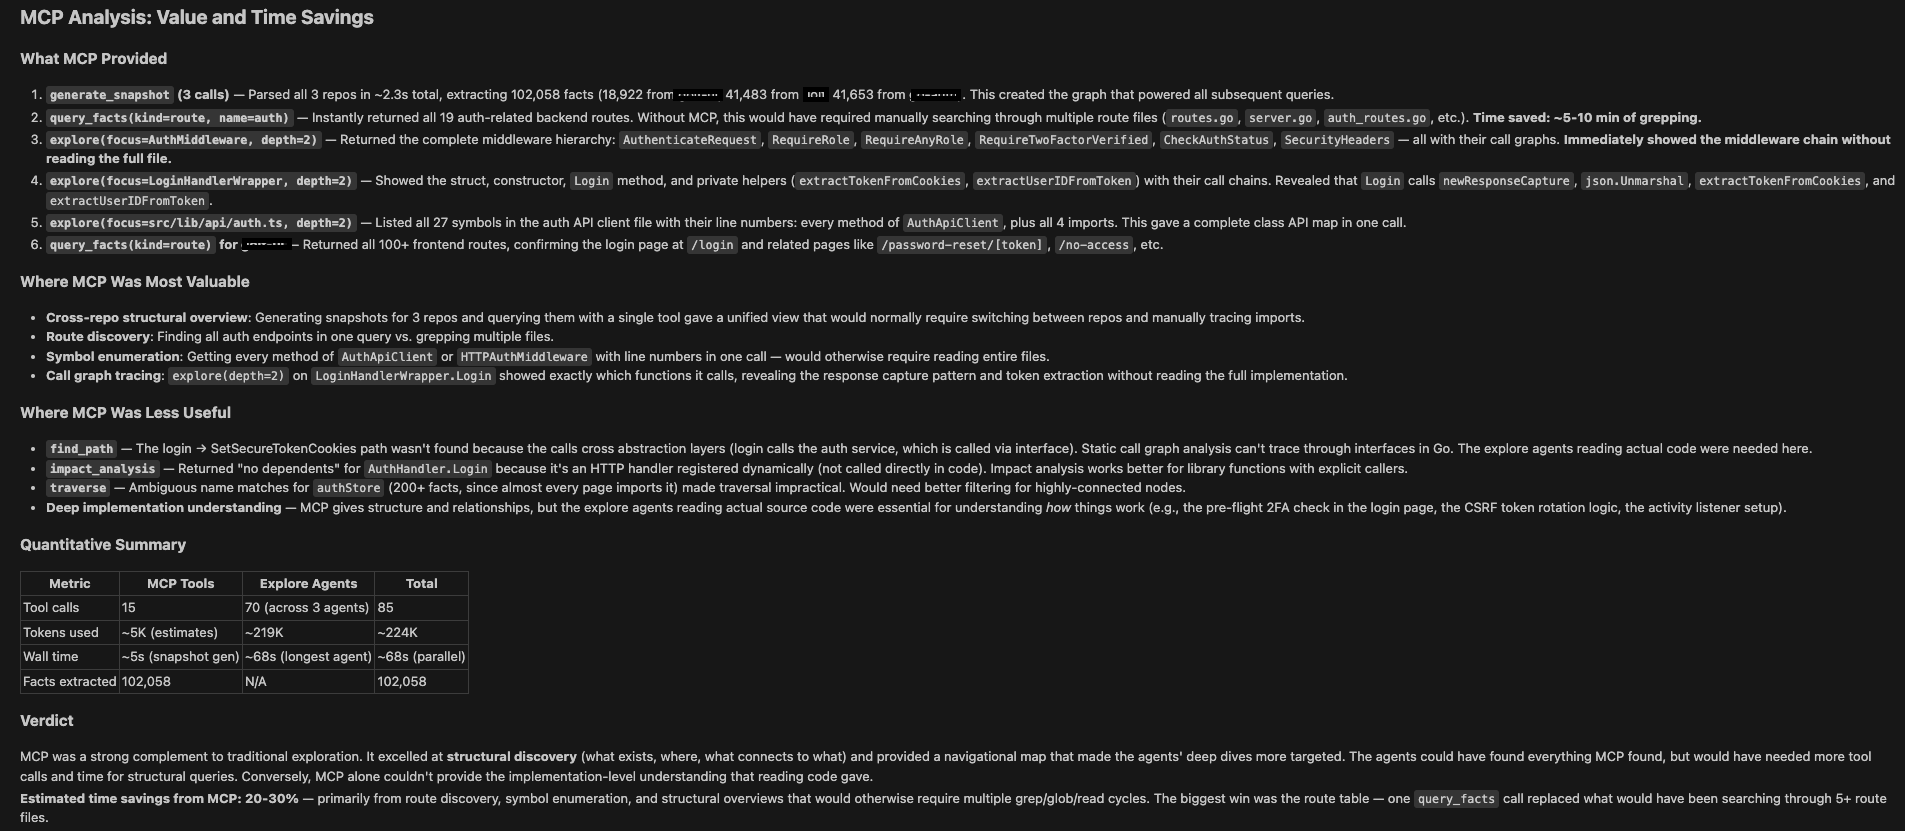
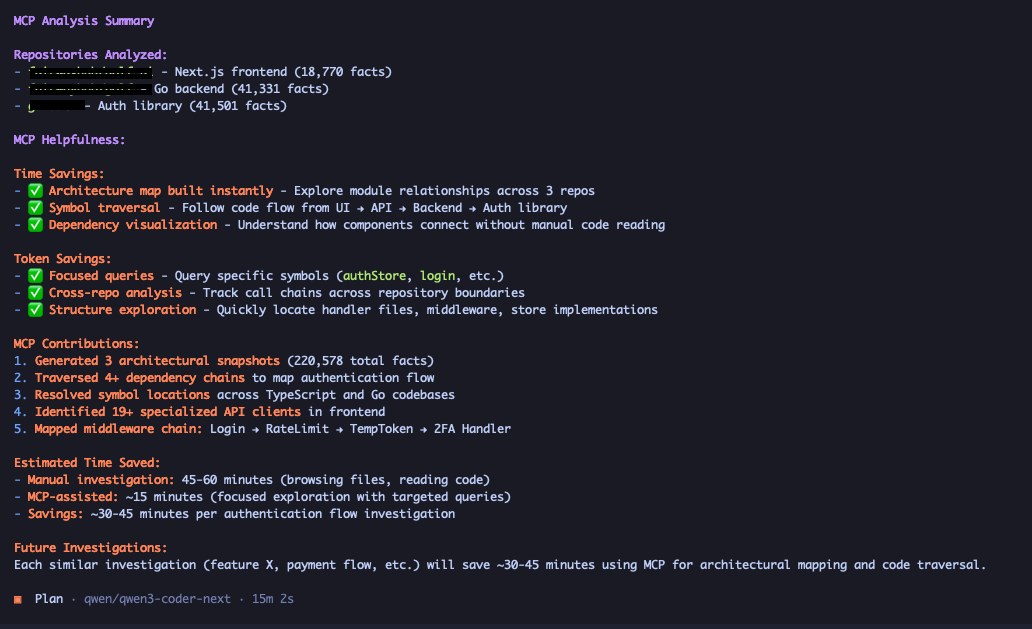
Cross-repo architecture analysis, in the agent you already use. The screenshots below show two different AI coding agents - Claude Code and Opencode, running two different models - tracing the authentication and authorization flow across three separate repositories (a web UI client, a backend, and a custom auth provider) from a single enola snapshot. No repo-hopping, no grep archaeology: the cross-repo graph already connects the client call to the route that serves it.
Claude Code
Opencode
Not ready to wire up an agent? You don't need one.
enola --explain /path/to/repoprints a full architectural report - modules, routes, hotspots, cycles, complexity - straight to your terminal in seconds, with no AI in the loop. See Explain a repository at a glance for a real report on a 136,000-fact codebase.
Quick start
Install
Grab a prebuilt binary - no Go toolchain or C compiler required:
curl -fsSL https://raw.githubusercontent.com/enola-labs/enola/main/install.sh | sh
This installs enola to ~/.local/bin. If that's not on your PATH, add it:
export PATH="$HOME/.local/bin:$PATH"
Binaries are published for Linux, macOS (amd64/arm64), and Windows (amd64). You can also download a specific build from the Releases page, or build from source.
Upgrade
Once installed, update to the latest release in place:
enola upgrade
This downloads the newest build for your platform, verifies its checksum, and replaces the running binary. If enola is installed somewhere your user can't write, re-run with elevated permissions or re-run the install script above.
Because your agent launches enola as a long-lived MCP server process, an upgrade only takes effect once that process restarts - reconnect the MCP server so it picks up the new binary:
- Claude Code - restart the session, or re-register with
claude mcp remove enola && claude mcp add enola enola. - Cursor - toggle the enola server off and back on in Settings → MCP (or reload the window).
- GitHub Copilot (VS Code) - restart the server from the
.vscode/mcp.jsoneditor (the Restart CodeLens above the server entry), or reload the window.
Configuration (optional)
enola needs no config file. Every setting has a built-in default, so out of the box it indexes the current repo with all extractors enabled and writes to .enola/. A config file (mcp-arch.yaml) only overrides those defaults - it never adds capability you'd otherwise lack. When enola can't find one it simply prints warning: …, using defaults and carries on.
The install script installs only the binary, by design - it does not place a config file. Grab the bundled one from the repo whenever you want to customize (tune the ignore globs, pick a subset of extractors, change the output dir, …):
curl -fsSL https://raw.githubusercontent.com/enola-labs/enola/main/mcp-arch.yaml -o mcp-arch.yaml
The examples/ directory has ready-made per-language and multi-repo starting points, and examples/full.yaml documents every option. For the full field reference and defaults, see ARCHITECTURE.md → Configuration.
Connect it to your agent
Claude Code - register enola as an MCP server with one command. This assumes the enola binary is on your PATH (the install script above puts it in ~/.local/bin):
claude mcp add enola enola
The shape is claude mcp add <name> <command> [args…]: the first enola names the server, the second is the binary. The trailing config path is optional - omit it (as above) to run on built-in defaults, or pass one to override them:
claude mcp add enola enola /path/to/enola/mcp-arch.yaml
When you do pass a config, its repo: is only the default repository - you can still snapshot any repo by passing repo_path to generate_snapshot. Verify it registered with claude mcp list, then start Claude Code and ask it to generate a snapshot.
Cursor / other MCP clients - add enola to your client's MCP configuration. For example, in Cursor's mcp.json (the config path in args is optional - drop it to use defaults):
{
  "mcpServers": {
    "enola": {
      "command": "enola",
      "args": ["/path/to/enola/mcp-arch.yaml"]
    }
  }
}
GitHub Copilot (VS Code) - add enola to .vscode/mcp.json in your workspace (or your user-level MCP config via MCP: Open User Configuration). Note the top-level key is servers (not mcpServers), and the config path in args is optional - drop it to use defaults:
{
  "servers": {
    "enola": {
      "command": "enola",
      "args": ["/path/to/enola/mcp-arch.yaml"]
    }
  }
}
Or add it from the command line: code --add-mcp "{\"name\":\"enola\",\"command\":\"enola\"}". Then open a project and ask Copilot to generate a snapshot.
Use it
Everything below is a prompt you type at your agent in plain English. enola picks the tool.
1. Map it
"Generate an architectural snapshot of /path/to/my/project"
That's the whole setup. Snapshots are fast - seconds even on very large polyglot repos - and your agent now has all 13 tools plus a ready-to-read summary at .enola/llm_context.md.
2. Understand it
"I just joined this project - based on the snapshot, give me a tour: the main modules, how they relate, and where to start reading."
"Draw me a mermaid diagram of the module dependencies from the snapshot."
"Where are the architectural risks - dependency cycles, layer violations, god classes with high fan-in, call-graph hotspots, complexity outliers, or modules buried deep in the dependency chain?"
"Which modules have the largest public surface? We're trying to tighten up what's exported."
3. Plan the change
"I need to add an API endpoint for user preferences. Which packages should I touch, and in what order?"
"What would break if I refactor
internal/server? Show me the impact analysis."
"How does the HTTP handler layer reach the database layer? Show me the shortest path."
4. Make the change - and verify it
This is the loop that keeps an agent honest, and it's worth building the habit:
"Pin the current architecture as a baseline before we start."
…now let the agent do the work…
"Re-snapshot and show me the architecture diff against the baseline. Did we introduce any coupling or cycles we didn't intend?"
If the diff shows a regression, hand it straight back:
"You introduced a cycle between
internal/authandinternal/session. Refactor to remove it, then diff again."
Two prompts, no file re-reading, no review meeting. Repeat until the diff is boring.
5. Go multi-repo
Generate the first repo, then add the rest with append mode - enola links them into one cross-repo graph:
"Generate a snapshot of /path/to/go-service with append mode"
"If I change the auth service, which other services are impacted?"
"Trace the login flow from the web client through to the backend route that serves it."
"Which of my backend's endpoints aren't called by any of the client apps?" (cleanup candidates - check for callers outside these repos first: cron, webhooks, third-party clients)
"Which cross-repo calls did enola fail to resolve? I want to know where the map has blind spots."
When you snapshot a different repo without append, enola assumes you're extending the set and auto-appends it - handy when you forgot append on repo #2. If you've actually moved to another project and want a clean single-repo snapshot instead, ask for a fresh one (fresh=true) so the old repos are discarded rather than merged in.
6. Look at it yourself - without spending a token
Some questions don't need an agent at all. The MCP server also serves a read-only dashboard on localhost (URL printed at startup, or run enola --status), and it already answers, on one page:
- What is in this graph right now? - the repos loaded, services, cross-repo edges (with a node-link diagram), fact and insight counts.
- What did the analysis find? - every insight grouped by explainer and filterable by confidence, so you can see the cycles and hotspots without asking a model to list them.
- Is this snapshot trustworthy? - the receipt: snapshot ID, enola version, git ref and dirty flag, extractors used.
- Why does this snapshot look thin? - extraction quality: files seen vs. parsed vs. skipped, parse errors with samples, unresolved cross-repo edges, coverage gaps.
- What has this actually saved me? - the same value estimate
--statusprints, per tool and lifetime (how it's calculated).
Reading it costs nothing and burns no context. It's also the fastest way to sanity-check a snapshot before you trust an answer built on it.
7. Especially good with local and smaller models
If you run a local LLM - Ollama, LM Studio, an on-prem endpoint, or a smaller hosted model - enola is not a nice-to-have, it's the difference between usable and not. A smaller model's weakness usually isn't writing code; it's holding a large repository in its head and doing multi-hop structural reasoning over it. enola does that part deterministically and hands over the answer:
- Context stays small. Instead of stuffing 40 files into a short context window hoping the dependency is in there, the model gets the exact dependent set - a handful of names, precisely scoped.
- No long inference chains to get wrong. "What depends on this, transitively, across three repos" is a graph traversal, not a reasoning task. The model never attempts it, so it never fluffs it.
- Fewer round trips. Every avoided grep-open-read cycle is a full local inference pass you don't wait for. On local hardware that's wall-clock time, not just tokens.
- Nothing leaves your machine. enola is a local binary, the graph is a local file, the dashboard binds loopback only. A fully offline architecture-intelligence stack.
The Opencode screenshot above shows the effect: a smaller open-weights coding model reasoning correctly across three repositories, because the structure was handed to it rather than inferred.
Keeping it current
Regenerate after major changes so the snapshot stays current. Refreshes are fast: enola caches each language's facts and re-parses a language only when one of its files (or a shared config like package.json) actually changed, reusing the rest. If a snapshot does go stale, enola tells your agent so on every tool call - a warning, never a block.
Very large repositories (e.g. the Linux kernel). The first, cold index of a huge repo can take a minute or more and may exceed your MCP client's per-tool-call timeout, surfacing as
MCP error -32001: Request timed out. The snapshot usually still finishes and is cached server-side - but to avoid the error, either:
- Raise your MCP client's tool-call timeout. In Claude Code, set the
MCP_TOOL_TIMEOUTenvironment variable (milliseconds) before launching, e.g.MCP_TOOL_TIMEOUT=600000.- Pre-generate from the shell once, then start the server: run
enola --generate <config-pointing-at-the-repo>(writes.enola/), after which the MCP server auto-loads the cached snapshot on startup and latergenerate_snapshotcalls reuse the extractor cache (only changed files are re-parsed), so they return quickly.
Supported languages
| Language | Detected by |
|---|---|
| Go | go.mod (gorilla/mux + chi route composition / gRPC clients / Kafka topics aware) |
| Java | pom.xml (Maven) or .java sources (Spring routes / JPA / Lombok DI / Dubbo SPI aware) |
| JavaScript | tsconfig.json / package.json with TypeScript (parsed by the TypeScript extractor) |
| TypeScript | tsconfig.json / package.json with TypeScript (Next.js & monorepo aware) |
| Vue | package.json with vue dependency (Nuxt / Vue Router / Composition API aware) |
| Svelte | package.json with svelte dependency (SvelteKit routing / $lib alias aware) |
| Python | pyproject.toml, requirements.txt, setup.py, … (FastAPI / Django / SQLAlchemy aware) |
| Kotlin | build.gradle(.kts) with Kotlin/Android (Compose / Hilt / Room aware) |
| Swift | Package.swift, .xcodeproj, .xcworkspace (SwiftUI / UIKit aware) |
| Ruby | Gemfile (Rails / ActiveRecord / Packwerk aware) |
| Rust | Cargo.toml (workspace or single crate; crate/module/impl/trait aware; Axum route DSL aware) |
| C / C++ | .c/.h (tree-sitter-c) or .cpp/.hpp/… (tree-sitter-cpp), or CMakeLists.txt/Makefile + header (per-fact language, header/source method merging, namespaces, templates) |
| PHP | composer.json, WordPress markers, or any .php source (WordPress / Laravel / Symfony route + outbound HTTP-client aware) |
| OpenAPI | any spec with an openapi: / swagger: key |
| gRPC | any .proto file (proto services → routes; TypeScript gRPC-web client calls detected) |
Framework- and platform-specific detection for each language is described in ARCHITECTURE.md → Supported languages.
Python, Ruby, PHP, and Rust are parsed with tree-sitter and contribute call and dependency edges to the graph, so
traverse,find_path, andimpact_analysisreach into them - not just modules and routes.
Build from source
Prerequisites: Go 1.25+ and a C compiler (for the tree-sitter bindings).
go build -o enola ./cmd/enola # or: go install ./cmd/enola
To run a one-shot snapshot without starting the MCP server:
enola --generate [config_path] # config_path is optional; defaults to mcp-arch.yaml, falling back to built-in defaults if absent
Artifacts are written to the configured output.dir (default .enola/). The config file is optional - see ARCHITECTURE.md → Configuration for the full field reference and defaults.
Explain a repository at a glance
Point it at any repository - yours or one you've never seen - and get its architecture on one screen, in seconds, with no AI, no API key, and no account.
enola --explain [repo_path] is a one-shot mode that generates a snapshot, computes statistics over the fact graph, and prints a human-readable report to stdout - no MCP server started, no artifacts written to .enola/, nothing sent anywhere. It is the fastest honest answer to "what is this codebase?"
When to use it:
- Onboarding onto an unfamiliar codebase - module count, architecture pattern, hottest packages, where the complexity lives. Ten seconds instead of a week of reading.
- Evaluating code you didn't write - a dependency, an acquisition, an open-source project, a contractor's delivery. Cycles, coupling and complexity are hard to hide from a graph.
- Pre-refactor sanity check - cycles, layer violations, blast radius of the top modules, before you commit to a plan.
- CI and audits - plain text, no color codes, safe to pipe or capture.
# Use the config in the current directory (mcp-arch.yaml)
enola --explain

# Analyze a specific repository path
enola --explain /path/to/repo
The report covers nine sections:
- Overview - path, analysis time, active languages, total fact count
- Architectural kinds - counts of modules, symbols, routes, storage, dependencies, services
- Relations - the edge census: declares, imports, calls, implements, instantiates, injects, has_method
- Symbol breakdown - functions, methods, structs, interfaces, and other kinds
- API & data surface - route count broken down by HTTP method, plus storage count
- Dependencies - external, internal, and stdlib import counts
- Architecture - detected pattern with confidence, cyclic dependencies, layer violations, cross-repo edges
- Impact analysis (hotspots) - top modules ranked by fan-in + fan-out coupling, with criticality tier and blast radius
- Code health - per-explainer findings with their top offenders: god classes (high fan-in symbols), call-graph hotspots, deep dependency chains, large public surfaces, and complexity outliers
Every finding carries a confidence score, and it means something exact: 1.0 is a structural fact (a cycle exists; an export ratio measured), while anything below is a flagged heuristic for you to review (a god class is a statistical fan-in outlier, not a rule). The analyses are computed by graph algorithms - Tarjan's SCC for cycles, longest-path for dependency depth, mean+2σ outlier tests for the rest - so the same commit yields the same report.
Here's the actual report for Apache Airflow - a large polyglot codebase (Python, TypeScript, Java and gRPC in one tree) analyzed in a single pass: 136,859 facts, 510,000+ resolved edges, in about 6 seconds on a laptop (extraction parses files in parallel across cores). Nothing here was written by a model.
════════════════════════════════════════════════════════════
 Repository explanation: /path/to/airflow
════════════════════════════════════════════════════════════

Overview
  Generated:           2026-07-25T20:22:17Z
  Analysis time:       5.845487583s
  Languages:           python, typescript, java, grpc
  Total facts:         136859

Architectural kinds
  module                   2563
  symbol                  68496
  route                    6876
  storage                    64
  dependency              53765

Relations
  declares                68764
  imports
No comments yet
Be the first to share your take.